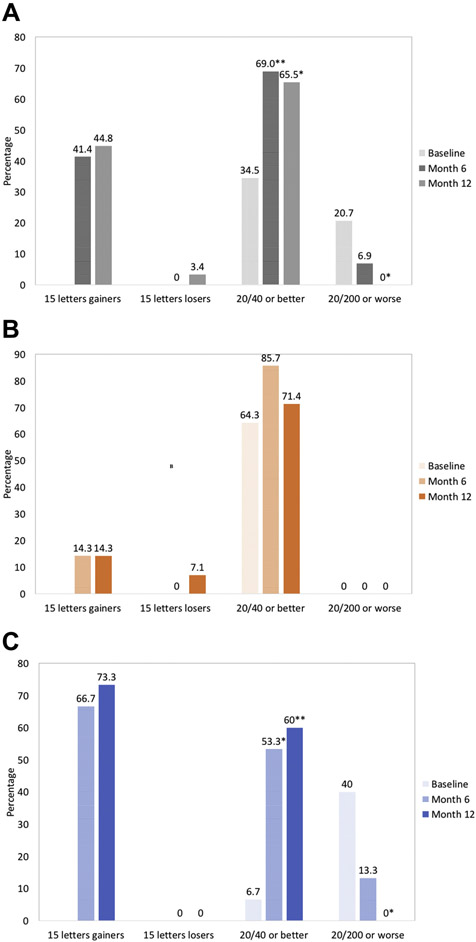
Figure 6:
Additional key secondary endpoints. Bar graph showing functional outcomes after 6 months and 12 months of treatment for the full analysis set (A), patients diagnosed with DME (B), and patients diagnosed with RVO (C). Proportion of eyes that gained and lost ≥ 15 letters from baseline; proportion of eyes that had a best-corrected visual acuity (BCVA) ≥ 20/40 and ≤20/200. *P < 0.05, **P < 0.01, and ***P < 0.0001 versus baseline.

