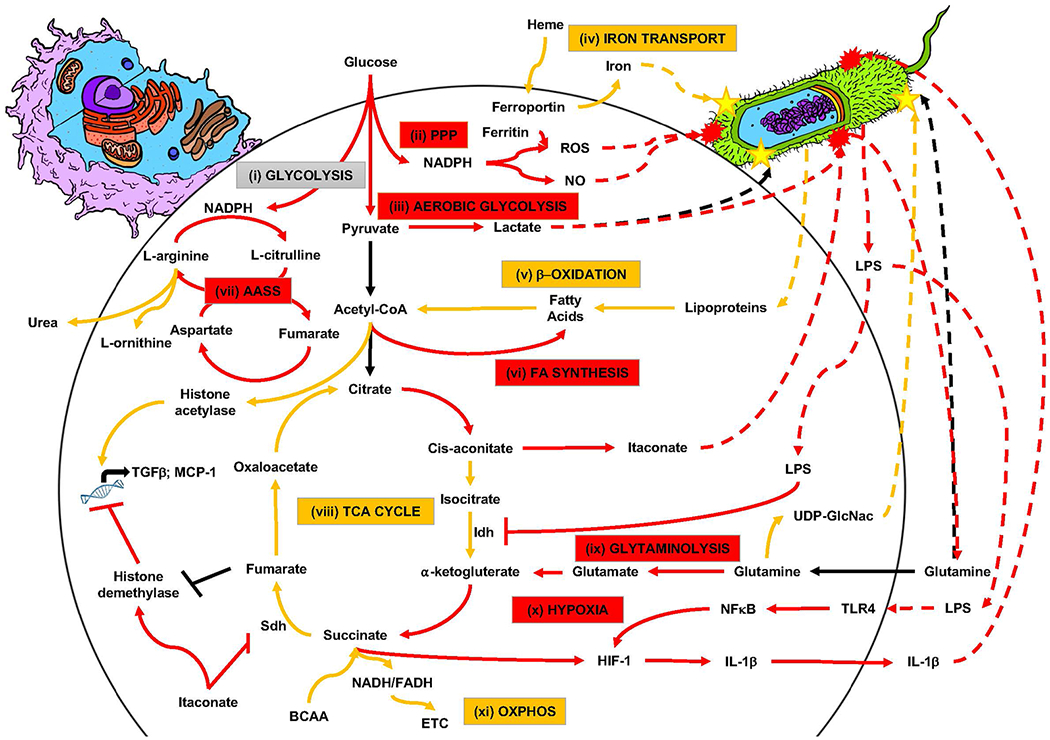
Figure 2: Metabolic immunomodulation of macrophage functional phenotype and host-pathogen interactions.

Current schematic model of metabolic immunomodulation of macrophage functional phenotype presented as classically activated M1 (red boxes and lines) and alternately activated M2 (yellow boxes and lines), based on currently published research. Grey “glycolysis” textbox indicative of homeostatic metabolism in M0/M1/M2. Colored textboxes indicate energetic investment in metabolic pathways during polarization (M1/M2). Solid lines indicate metabolic pathways of interest to polarization (M1/M2; simplified for overall view). Dashed lines indicate pathogen-derived metabolites or pathogen-directed metabolites of host-pathogen metabolic interaction. Yellow stars on pathogen indicate effects of benefit to survival of the pathogen and red explosive shapes on pathogen indicate effects of harm to pathogen survival.
Source: Original art by co-author Tyler Lawton; pathway model based on referenced research in body of review article.
