
Figure 4.
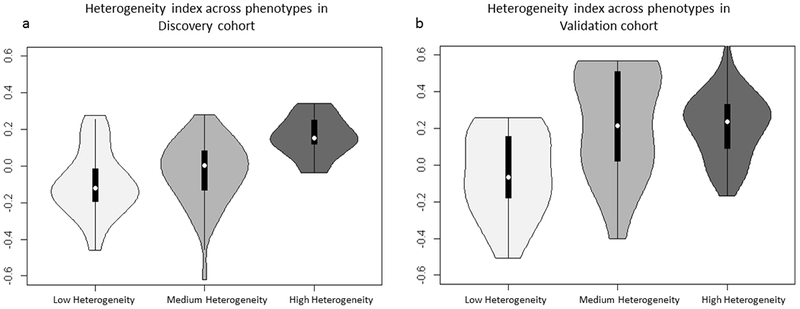
Heterogeneity index* distributions of women in low, medium, and high heterogeneity phenotypes in the discovery (A) and validation (B) cohorts.
* defined as the statistical average of z-score normalized, heterogeneity standardized features in the final feature vector for each tumor in the discovery and validation cohorts.