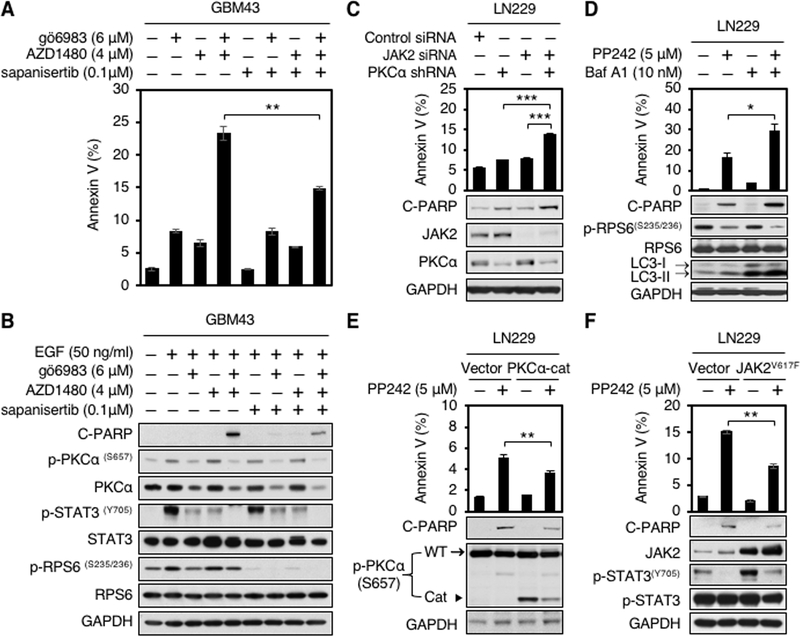
Figure 4.
Apoptosis induced by PP242 requires blockade of PKCα and JAK2. A, GBM43 cells were treated with PKC inhibitor gö6983, JAK2 inhibitor AZD1480, TORKi sapanisertib, gö6983 plus AZD1480, gö6983 plus sapanisertib, AZD1480 plus sapanisertib, or gö6983 plus AZD1480 and sapanisertib at indicated doses for 48 hours. Apoptosis was analyzed by flow cytometry for annexin V. Data shown represent mean ± SD (percentage of apoptotic cells relative to DMSO-treated control) of triplicate measurements (Student’s t test, p = 0.0007, DMSO versus gö6983 plus AZD1480; p = 0.0011, gö6983 versus gö6983 plus AZD1480; p = 0.003, AZD1480 versus gö6983 plus AZD1480; p = 0.0007, sapanisertib versus gö6983 plus AZD1480; p = 0.0026, gö6983 plus sapanisertib versus gö6983 plus AZD1480; p = 0.0013, AZD1480 plus sapanisertib versus gö6983 plus AZD1480; p = 0.0038, gö6983 plus AZD1480 and sapanisertib versus gö6983 plus AZD1480) (top panel). B, An aliquot of each lysate was analyzed by western blot with antibodies indicated (bottom panel). EGF (50 ng/ml) was added 15 minutes before harvest. C, LN229 parent cells stably expressing shRNA against PKCα were transfected with scramble siRNA or JAK2 siRNA for 72 hours. Apoptosis was analyzed by flow cytometry for annexin V. Data shown represent mean ± SD (percentage of apoptotic cells relative to DMSO-treated control) of triplicate measurements (Student’s t test, p = 0.0002, scramble siRNA versus PKCα shRNA plus JAK2 siRNA; p = 0.0004, PKCα shRNA versus PKCα shRNA plus JAK2 siRNA; p = 0.0003, JAK2 siRNA versus PKCα shRNA plus JAK2 siRNA) (top panel). An aliquot of each lysate was analyzed by western blot with antibodies indicated (bottom panel). Blot representative of two independent experiments is shown. D, LN229 parent cells were treated with PP242, bafilomycin A1, or PP242 plus bafilomycin A1 at indicated doses for 72 hours. Apoptosis was analyzed by flow cytometry for annexin V. Data shown represent mean ± SD (percentage of apoptotic cells relative to DMSO-treated control) of triplicate measurements (Student’s t test, p = 0.0046, DMSO versus PP242 plus Baf A1; p = 0.0324, PP242 versus PP242 plus Baf A1; p = 0.0054, Baf A1 versus PP242 plus Baf A1) (top panel). An aliquot of each lysate was analyzed by western blot with antibodies indicated (bottom panel). E, LN229 parent cells were transduced with empty vector, or a dominant-active allele of PKCα (PKCα-Cat). Cells were treated with 5 μM PP242 for 72 hours. Apoptosis were analyzed by flow cytometry for annexin V. Data shown represent mean ± SD (percentage of apoptotic cells relative to DMSO-treated control) of triplicate measurements {Student’s t test, p = 0.0016, DMSO (vector) versus PP242 (vector); p = 0.0008, DMSO (PKCα-cat) versus PP242 (Vector); p = 0.0044, PP242 (PKCα-cat) versus PP242 (vector)} (top panel). An aliquot of each lysate was analyzed by western blot with antibodies indicated (bottom panel). In p-PKCα immunoblot, the top band (arrow) indicates endogenous PKCα, whereas the low band (arrowhead) indicates a dominant-active allele of PKCα (PKCα-Cat). F, LN229 parent cells were transfected with empty vector, or a gain-of-function mutation of JAK2 (JAK2V617F). Cells were treated with 5 μM PP242 for 72 hours. Apoptosis were analyzed by flow cytometry for annexin V. Data shown represent mean ± SD (percentage of apoptotic cells relative to DMSO-treated control) of triplicate measurements {Student’s t test, p = 0.0001, DMSO (vector) versus PP242 (vector); p = 0.0001, DMSO (JAK2V617F) versus PP242 (Vector); p = 0.0014, PP242 (JAK2V617F) versus PP242 (vector)} (top panel). An aliquot of each lysate was analyzed by western blot with antibodies indicated (bottom panel).

