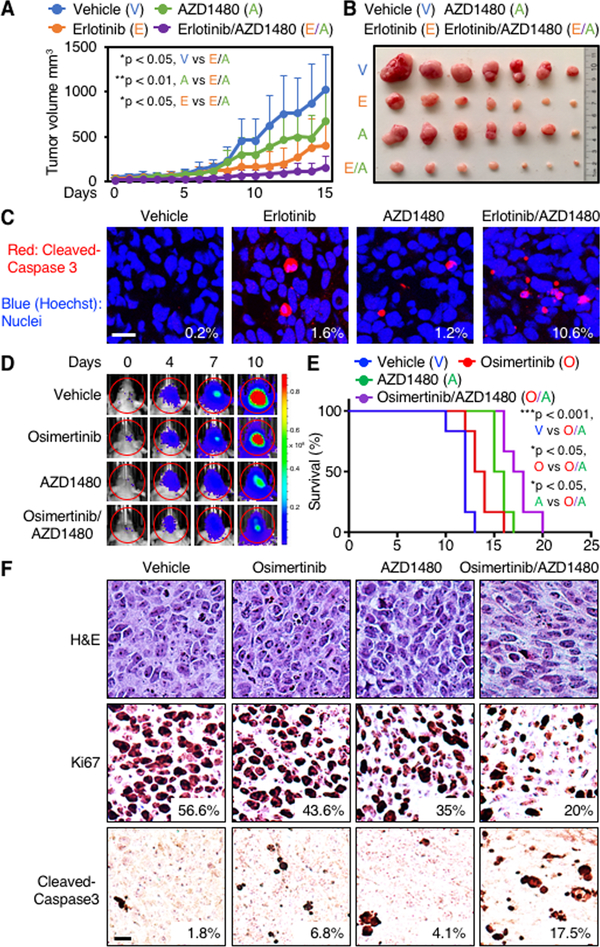
Figure 6.
EGFR and JAK2 inhibitors in combination induce apoptosis in patient-derived flank and orthotopic xenograft models. A, 5×10⁶ GBM34 cells were injected subcutaneously in BALB/cnu/nu mice. After tumor establishment, seven mice in each group were treated orally once daily with vehicle (0.5% HPMC, 0.1% Tween 80 in H2O), 50 mg/kg erlotinib, 15 mg/kg AZD1480, or 50 mg/kg erlotinib plus 15 mg/kg AZD1480 for 15 days. Tumor sizes were measured every day for 15 days (Student’s t test, p = 0.0177, vehicle versus erlotinib plus AZD1480; p = 0.00373, AZD1480 versus AZD1480 plus erlotinib; p = 0.0457, erlotinib versus erlotinib plus AZD1480. n = 7 mice per group). B, Representative tumors after 15 days. C, Three animals from each group in (A and B) were euthanized on day 15. Tumors were analyzed by immunofluorescence with antibody to cleaved caspase 3 (red). Hoechst (blue) stains nuclei. The percentage of positive cells was calculated. Data shown are mean ± SD of five microscopic fields from three tumors in each group (Student’s t test, p < 0.0001, vehicle versus erlotinib plus AZD1480; p < 0.0001, erlotinib versus erlotinib plus AZD1480; p < 0.0001, AZD1480 versus erlotinib plus AZD1480). Scale bar: 10 μm. D, 7×10⁴ GBM43 cells expressing firefly luciferase were injected intracranially into BALB/cnu/nu mice. After tumor establishment, mice were sorted into four groups and treated daily by oral gavage, with vehicle, osimertinib (25 mg/kg), AZD1480 (30 mg/kg), or osimertinib (25mg/kg) plus AZD1480 (30mg/kg). Bioluminescence imaging of tumor-bearing mice was obtained at days shown (day 0 was start of treatment), using identical emission and excitation spectra, and exposure times for each set of measurements. Dynamic measurements of bioluminescence intensity (BLI) in treated tumors over time. Regions of interest (ROIs) from displayed images were revealed on the tumor sites and quantified as maximum photons/s/cm2 squared/steradin. Data shown represent mean of photon flux ± SD from n = 6 mice per group. E, Survival curves of BALB/cnu/nu injected intracranially with GBM43 cells. Mice treated daily by oral gavage, with vehicle, osimertinib (25 mg/kg), AZD1480 (30 mg/kg), or osimertinib (25 mg/kg) plus AZD1480 (30 mg/kg) (p = 0.0006, vehicle versus osimertinib plus AZD1480; p = 0.024, osimertinib versus osimertinib plus AZD1480; p = 0.0198, AZD1480 versus osimertinib plus AZD1480; log-rank analysis; n = 6 mice per group). F, Three animals from each group treated in D were sacrificed at endpoint. Samples were analyzed by immunohistochemistry for cleaved caspase 3. Panels show representative images. Percentage of tumor cells that stained positively for cleaved caspase 3 and Ki67 from 5 high power microscopic fields in each group is indicated. Scale bar = 10 μm.

