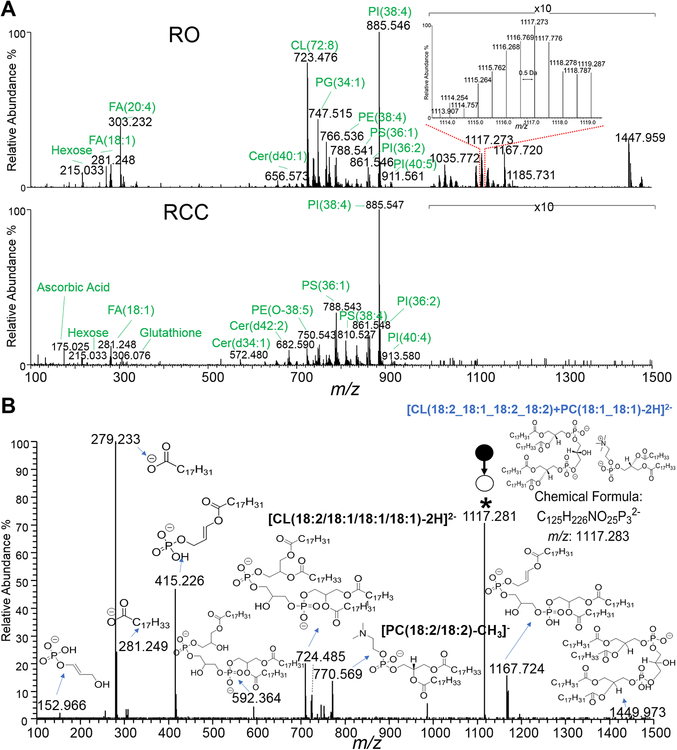
Figure 2.
Representative DESI mass spectra of RO and RCC tissues, and tandem mass spectrum of m/z 1117.3. A) Comparison between RO (on the top) and RCC (at the bottom) mass spectrum in the m/z 100 to m/z 1500 range. B) The m/z 1117.3 ion was assigned as CL(18:2_18:1_18:2_18:2)+PC(18:1_18:1) based on the fragmentation pattern. (* indicates the parent ion). The parent ion fragments of both CL(18:2_18:1_18:2_18:2) and PC(18:1_18:1) with loss of CH3 could be observed.

