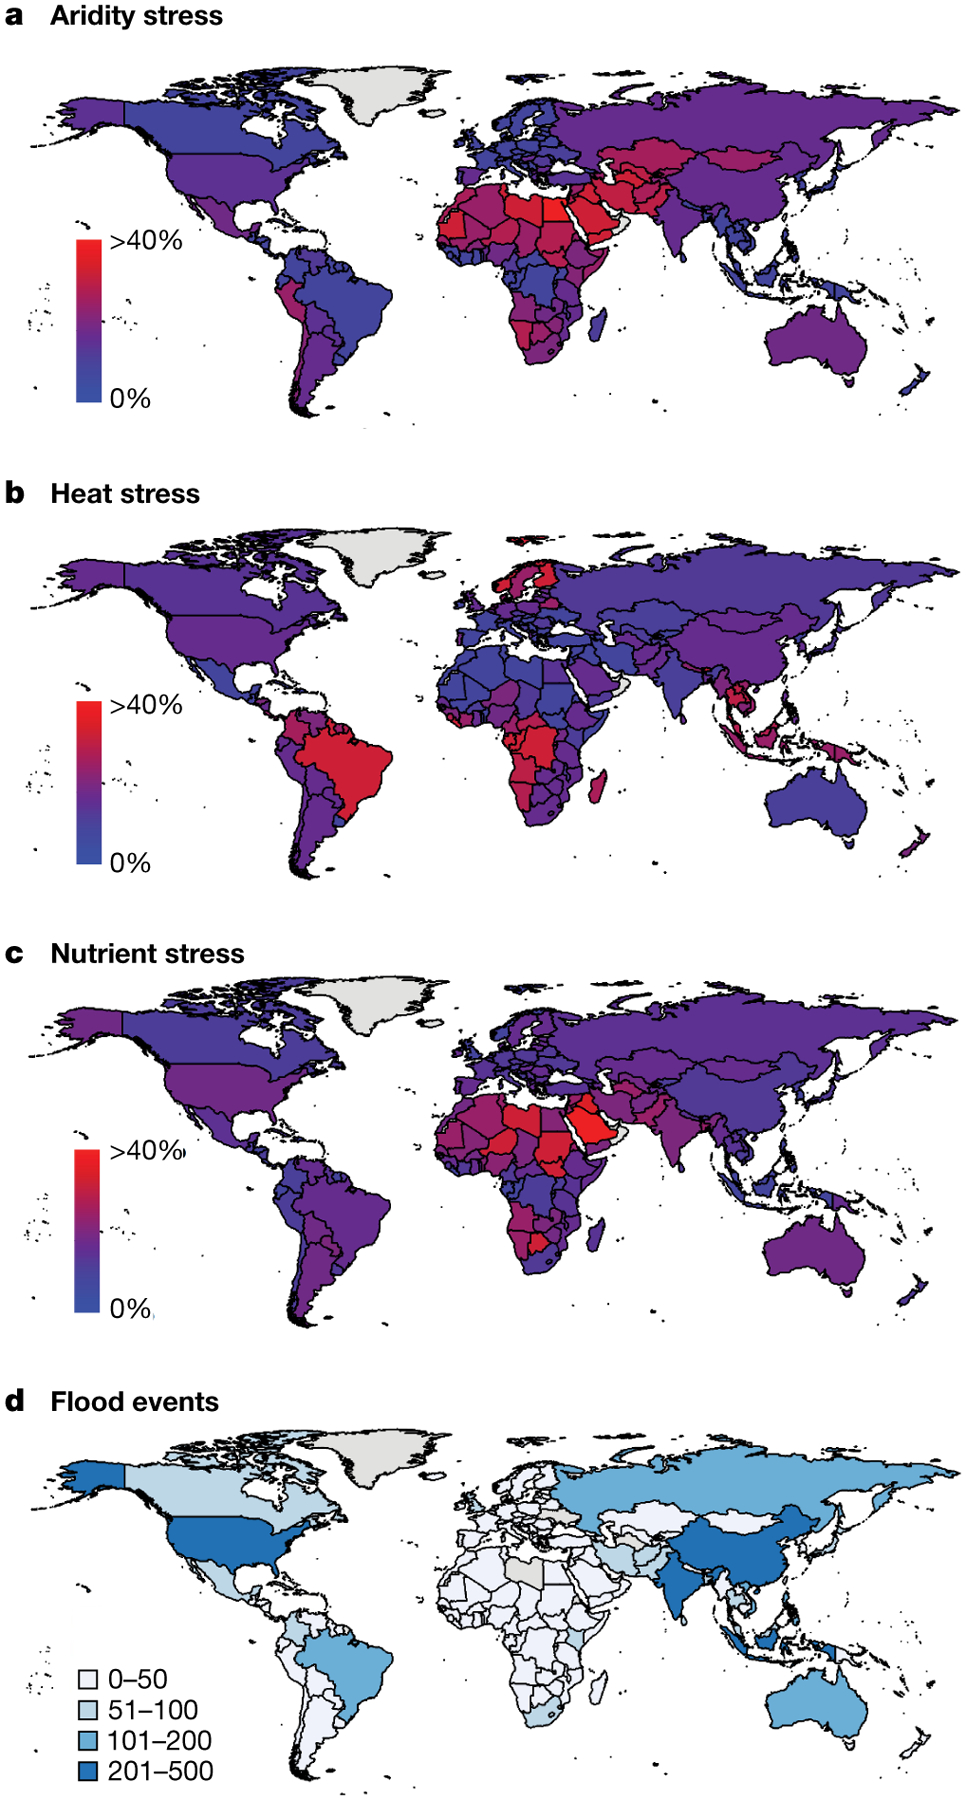
Fig. 1 |. Predicted national-scale yield loss for maize, rice, wheat and soybean.

a–c, Maps indicate the yield losses caused by aridity stress averaged from 1950–2000 (a), heat stress averaged from 1994–2010 (b) and nutrient stress in 2009 (c). National data for each crop were previously compiled13, and are here averaged and re-plotted using the maps package in R153. d, Number of large flood events from 1985 to 2010154 by country.
