Fig. 2.

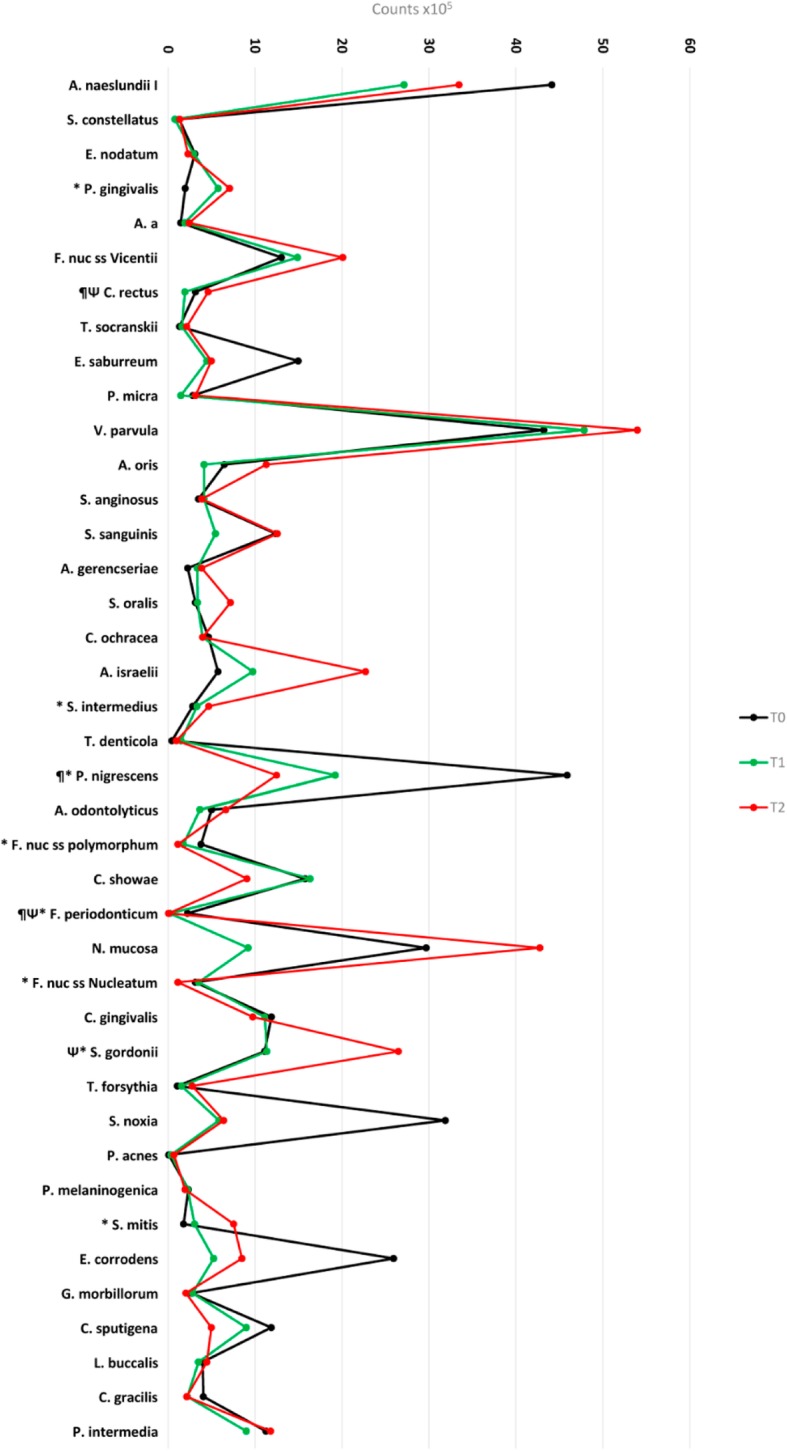
Mean counts (× 105) of 40 bacterial species at T0, T1, and T2. Statistically significant differences: T1 (*) and T2 (¶) when compared with T0; (Ψ) between T1 and T2. Wilcoxon test (p < 0,001)

Mean counts (× 105) of 40 bacterial species at T0, T1, and T2. Statistically significant differences: T1 (*) and T2 (¶) when compared with T0; (Ψ) between T1 and T2. Wilcoxon test (p < 0,001)