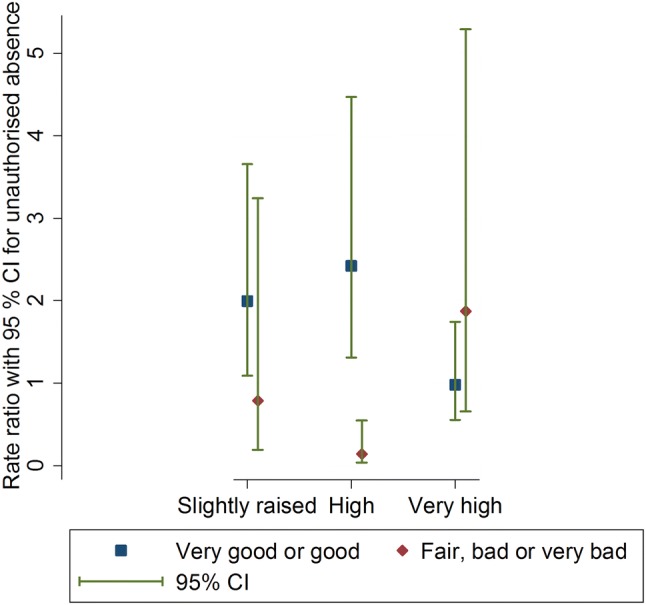
Fig. 3.

Graph to show general health (very good or good versus fair, bad or very bad) as a moderator of the association between teacher-reported emotional difficulties and unauthorised absence (graph displays rate ratios for children with slightly raised, high or very high, compared to close to average emotional difficulties scores)
