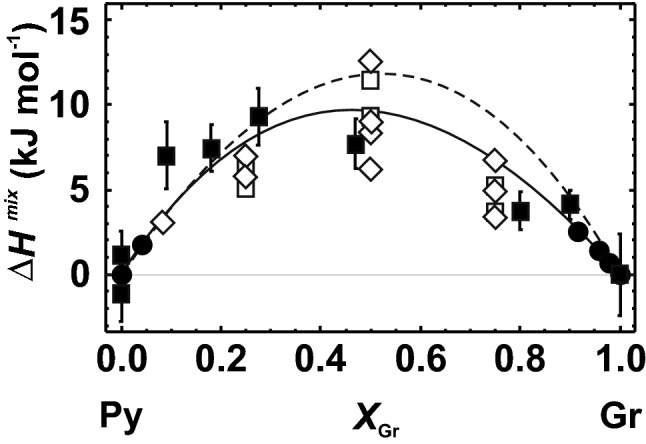
Fig. 2.

Heat of mixing (∆Hmix) of the pyrope (Py)–grossular (Gr) solid solution. Experimental data from Newton et al. (1977) are indicated by solid squares with error bars (1 sd). Closed circles represent ∆Hmix form LDA calculations using the single defect method and are modelled applying a Margules mixing model (solid line). Broken line shows the Margules fit to the results of GGA-PBE calculations (single defect). Open squares and diamonds: ∆Hmix derived from GGA-PBESOL and LDA calculations that are not based on the single defect method, but use different configurations in cells with intermediate composition
