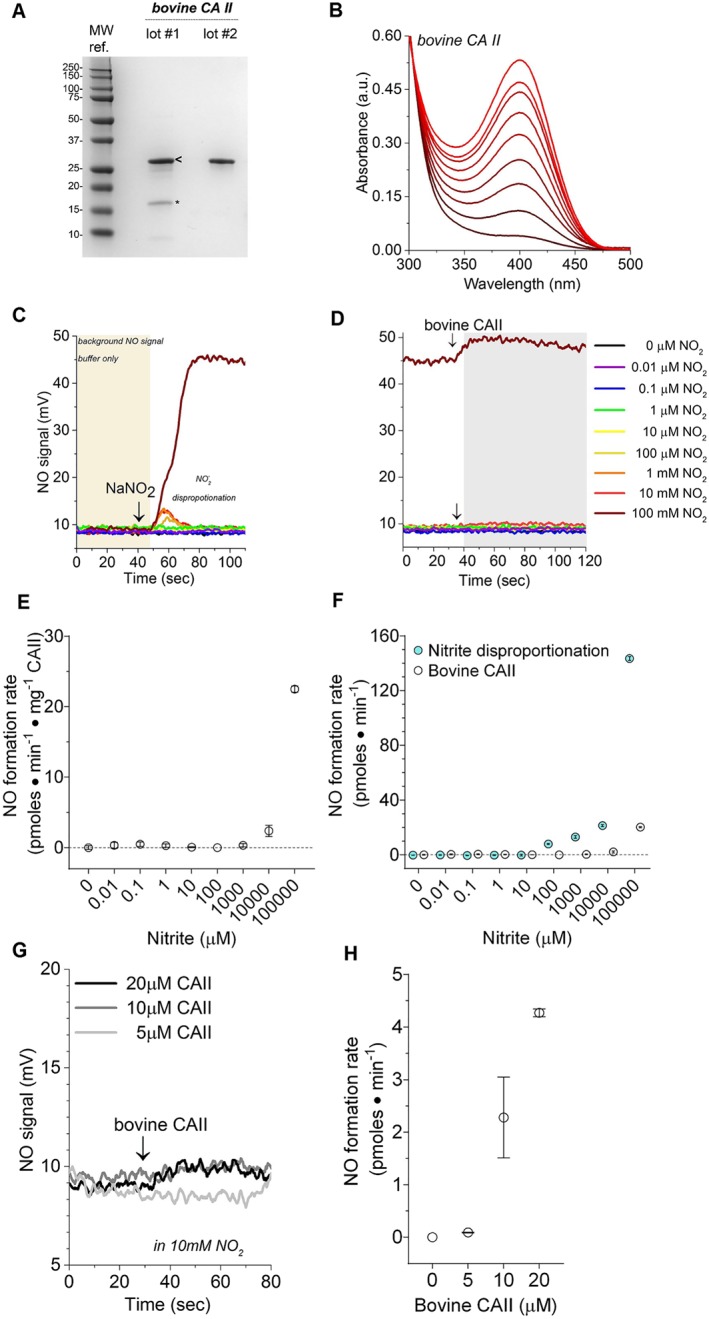
Figure 1.

Isolated bovine CAII enzyme characterization and reactivity with nitrite. (a) Bovine CAII purity visualized with Coomassie blue stained SDS‐PAGE. Two unique lots (labelled lot #1 and lot #2) of commercially available CAII (isolated from bovine erythrocytes) were investigated. Both lots contain a prominent 29 kDa band in agreement with the expected size of bovine CAII. However, low MW impurities are visible in lot #1. The bands in lot #1 labelled with “<” and “*” were analysed with MS. All enzymatic data presented in Figure 1b‐g were collected with the purified lot #2. Details on lot #1 are included in the Figure S1. (b) Bovine CAII p‐nitrophenyl acetate (p‐NPA) hydrolysis activity assay. The hydrolysis assays were conducted in 50‐mM phosphate buffer with 400‐μM 4‐NPA at 25°C and pH 7.5 using 3‐μM bovine CAII. The product of p‐NPA hydrolysis, p‐nitrophenyl acetate (p‐NP), has a characteristic absorbance at 405 nm. Accumulation of the p‐NP was monitored over 5 min, after the addition of bovine CAII. Background p‐NPA hydrolyses rates were collected for each reaction prior to the addition of enzyme and then subtracted from the measured enzymic rate. Isolated recombinant human CAII p‐NPA hydrolysis activity assay. (c) Representative raw data illustrating the effect of a range of nitrite concentrations (10‐nM to 100‐mM final concentration) on NO chemiluminescence. In each reaction, 20 μl of sodium nitrite was injected into the liquid reaction (purge) vessel of a Sievers 280i NO analyser (NOA), and then the NO signal was recorded. (d) Representative raw data obtained after the injection of 30‐μl bovine CAII (10 μM, final concentration) into the vessel with sodium nitrite. (e) Calculated NO‐production rates measured from the reaction of bovine CAII and nitrite. (f) Comparison of NO‐formation catalysed by bovine CAII and non‐enzymatic nitrite disproportionation. (g) The effect of 5‐, 10‐, and 20‐μM bovine CAII on NO‐production rates using nitrite as substrate. (h) Summary of the data presented in panel (g). Data are shown as mean ± SD, n = 3 collected from each independent protein lot
