
Figure 1.
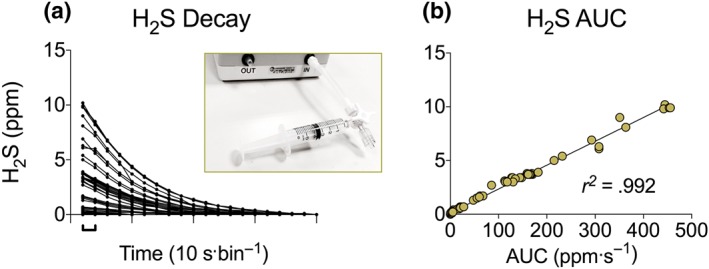
H2S release test. Comparison of (a) H2S values over time and (b) the AUC during washout. Inset picture in (a) shows the apparatus for H2S detection. Values recorded are in p.p.m
Official websites use .gov
A
.gov website belongs to an official
government organization in the United States.
Secure .gov websites use HTTPS
A lock (
) or https:// means you've safely
connected to the .gov website. Share sensitive
information only on official, secure websites.
H2S release test. Comparison of (a) H2S values over time and (b) the AUC during washout. Inset picture in (a) shows the apparatus for H2S detection. Values recorded are in p.p.m