
Figure 5.
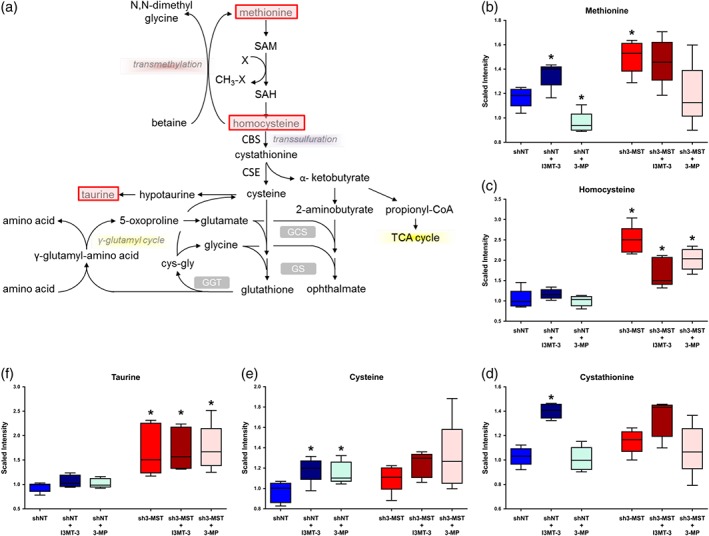
Altered 3‐MST activity perturbs sulfur metabolism in ECs. Global metabolomic profiling was performed on six groups as described in Figure 4 to determine the concentration of 669 metabolic compounds in each sample. (a) Schematic diagram of sulfur metabolism. Metabolites with significantly increased concentration after 3‐MST silencing and pathways with potential up‐regulation are shaded pink, while potentially down‐regulated pathways are shaded yellow. (b–f) Box plots of selected key metabolites in sulfur metabolism. Values for each sample are normalized by Bradford protein concentration, followed by median scaling and imputation. *P ≤ 0.05, shNT samples were compared to shNT control; and sh3‐MST samples were compared to their corresponding shNT treatment group; Student's unpaired t‐test. All six groups consisted of data of five independent experiments (n = 5).