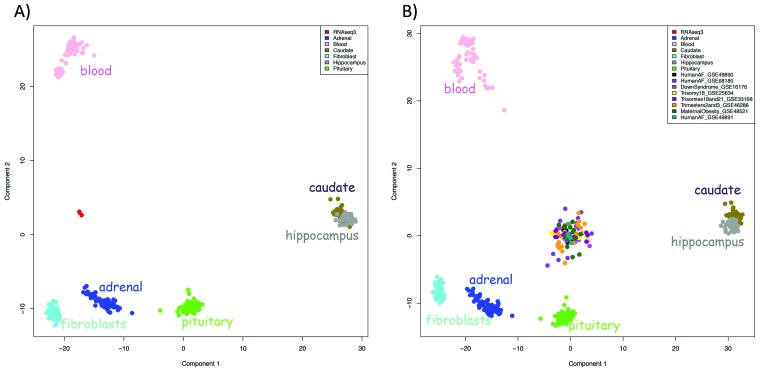
Figure 2.
MDS plot of gene expression. (A) Samples generated through RNAseq of cffRNA from vervet AFS form a distinct cluster separate from samples from various vervet postnatal tissues yet (B) cluster with transcripts from human AFS samples analyzed by using both RNAseq and a microarray platform. Different colors indicate different datasets as indicated in the key (the vervet AFS samples are shown in red; they form a cluster in the center of both plots).

