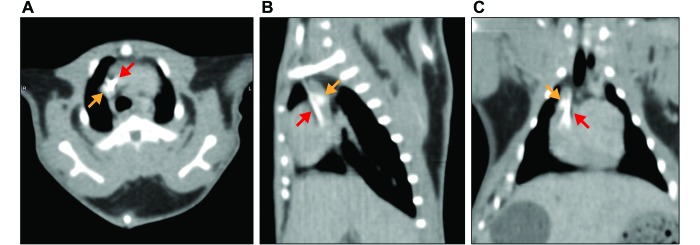
Figure 3.
(A) Axial, (B) sagittal, and (C) dorsoventral postcontrast CT images from guinea pig no. 3 at 25 d after catheter implantation, showing calcification in the right atrium–cranial vena cava junction (orange arrows) and collection of contrast material in the cranial vena cava, indicating a fibrinous sheath around the distal end of the catheter tip (red arrows).

