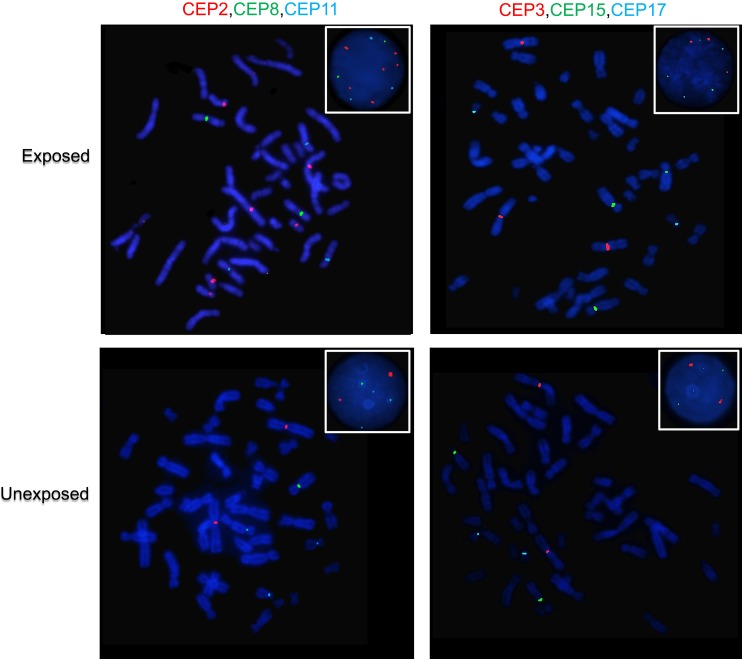
Figure 5.
Representative FISH images of an exposed and an unexposed individual. Metaphase spreads are shown and boxes indicate representative interphase nuclei for each case. In the exposed individual, more than two signals are observed for chromosomes 2, 3, 8, 11, 15 and 17, which is indicative of chromosomal instability. While in the unexposed individual, for each of the chromosomes indicated above, a normal number of signals (two signals) are observed. Three-color FISH was performed on nuclei spreads for chromosomes 2, 8 and 11 and, chromosomes 3, 15 and 17 using centromeric probes (CEP) labeled with different spectrum colors: spectrum orange for CEP2 and CEP3; spectrum green for CEP8 and CEP17; and spectrum aqua for CEP11 and CEP15.

