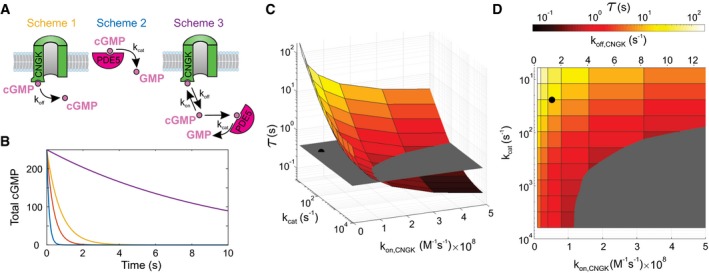
Figure 4. Discrete‐event simulations of cGMP dynamics.

- Schemes illustrate three different situations defined by chemical reactions (2) to (5) in the Materials and Methods section. Colors of schemes refer to the simulations shown in panel (B).
- Characteristic decay of V m in experiments shown in Fig 3A and C (orange; τrelax = 0.384 s) is compared with cGMP hydrolysis by PDE5 in the absence of CNGK channels (blue; characteristic time τ = 0.131 s), dissociation of cGMP from CNGK at the rate k off (yellow; τ = 0.748 s), and cGMP hydrolysis in the presence of CNGK channels and PDE (violet; τ = 9.73 s). Simulations were done using those parameters listed in Appendix Table S3. cGMP is given in molecules.
- Simulations of the rate of cGMP hydrolysis upon varying the catalytic rate k cat of active PDE and the k on rate of cGMP binding to the CNBD of the CNGK channel. The gray plane indicates the experimental relaxation time (τrelax). The black dot represents k cat (24/s) and k on (5.2 × 10⁷/M/s) compatible with previous studies (Appendix Table S3). The pairs of parameters compatible with the experimental τrelax are positioned at the intersection of the colored surface and the gray plane.
- Top view of panel C showing k off values compatible with k on rates used for simulations (assuming K D,CNGK = 25.7 nM; see Appendix Table S3).
