-
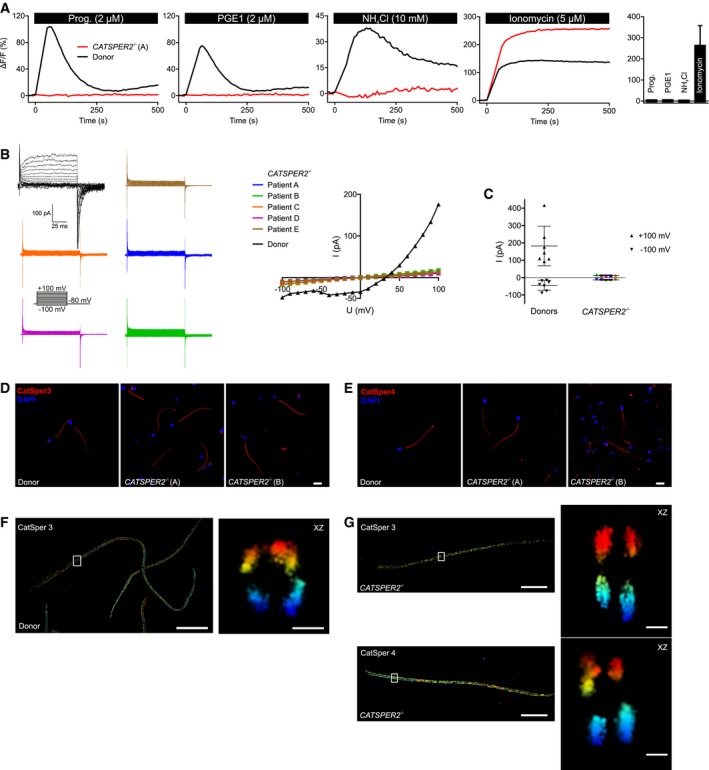
A
Representative Ca2+ signals in sperm from a patient with deafness‐infertility syndrome lacking functional CatSper channels (CATSPER2
−/−; red) and a healthy donor (black), evoked by progesterone, PGE1, NH4Cl, or ionomycin. NH4Cl increases the intracellular pH. Bar graph: Amplitudes (n = 4; mean ± SD) of Ca2+ signals in CATSPER2
−/− sperm.
-
B
Representative monovalent CatSper currents in CATSPER2
−/− sperm (blue, green, orange, purple, brown) and in sperm from a healthy donor (black), and corresponding current‐voltage relationship (right). The membrane voltage was stepped from −100 to +100 mV in increments of 10 mV from a holding potential of −80 mV.
-
C
Outward and inward current amplitudes (mean ± SD) at + 100 mV and ‐100 mV, respectively, in CATSPER2
−/− sperm (color code: panel B) and sperm from healthy donors (black).
-
D, E
Representative immunocytochemical staining of control sperm from healthy donors and CATSPER2
−/− sperm from DIS patients using antibodies directed against CatSper 3 (D) or CatSper 4 (E); DNA was labeled with DAPI (blue). Scale bars represent 10 μm.
-
F
3D‐STORM image in xy projection of sperm from a healthy donor labeled with the anti‐CatSper 3 antibody (left). Axial projection of the boxed region (right). Scale bars represent 5 μm in xy projections and 200 nm in axial projections.
-
G
3D‐STORM images in xy projection of CATSPER2
−/− sperm (left) labeled with the anti‐CatSper 3 (upper panel) or anti‐CatSper 4 (lower panel) antibody. Axial projection of the boxed regions (right). Scale bars represent 5 μm in xy projections and 200 nm in axial projections.