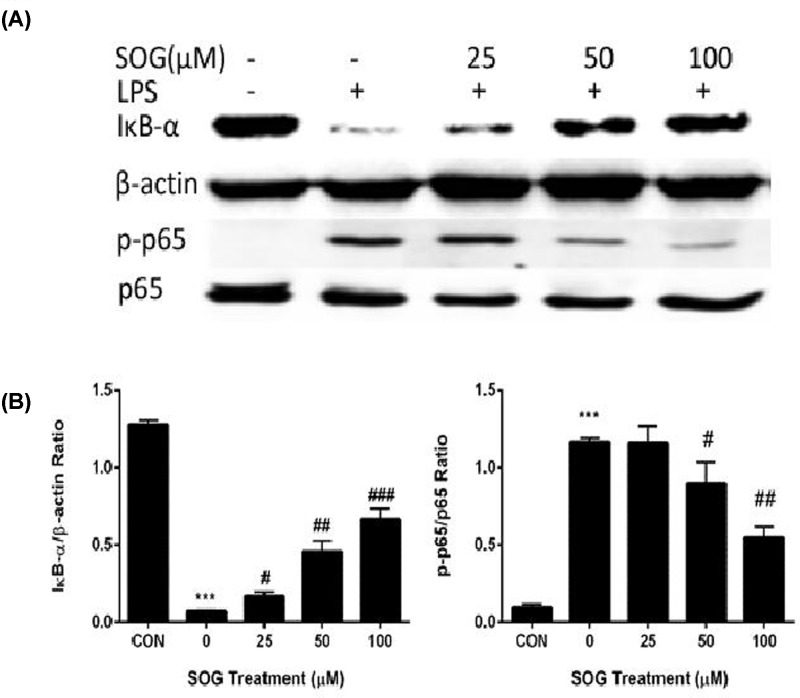
Figure 4. The effects of SOG on NF-κB activation in RAW264.7 cells stimulated by LPS.
Indicated doses of SOG (25, 50 and 100 μM) or DMSO (vehicle) were added to cells 30 min before LPS stimulation. RAW264.7 cells were collected and protein samples were prepared after LPS treatment for 15 minutes. (A) The degradation of IκB-α and phosphorylation of NF-κB p65 subunit were assessed using Western blot assay. (B) Band density was measured using ImageJ software. The relative levels of target proteins were compared between samples. The results of three independent experiments were expressed as means ± SEM. #P < 0.05, ##P < 0.01 and ###P < 0.001 versus group treated by vehicle; ***P < 0.001 versus group treated by LPS.

