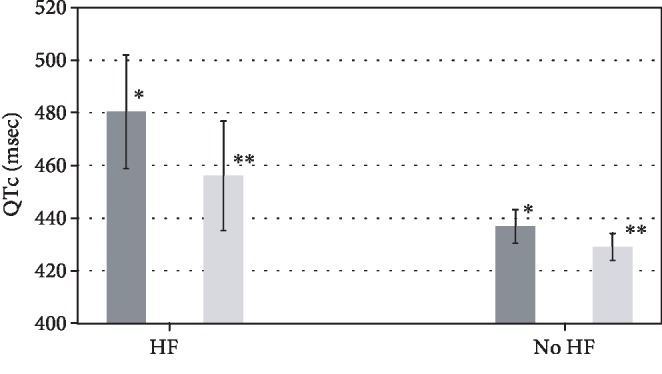
Figure 3.

QTc based on severity of OSA. Adjusted mean QTc values of subsequent analysis (severe OSA vs. nonsevere OSA). p value = 0.03 for severe vs. nonsevere OSA in patients with HF; p value = 0.06 for severe vs. nonsevere OSA in patients without HF. OSA = obstructive sleep apnea; HF = heart failure. ∗Patients with severe OSA. ∗∗Patients without severe OSA.
