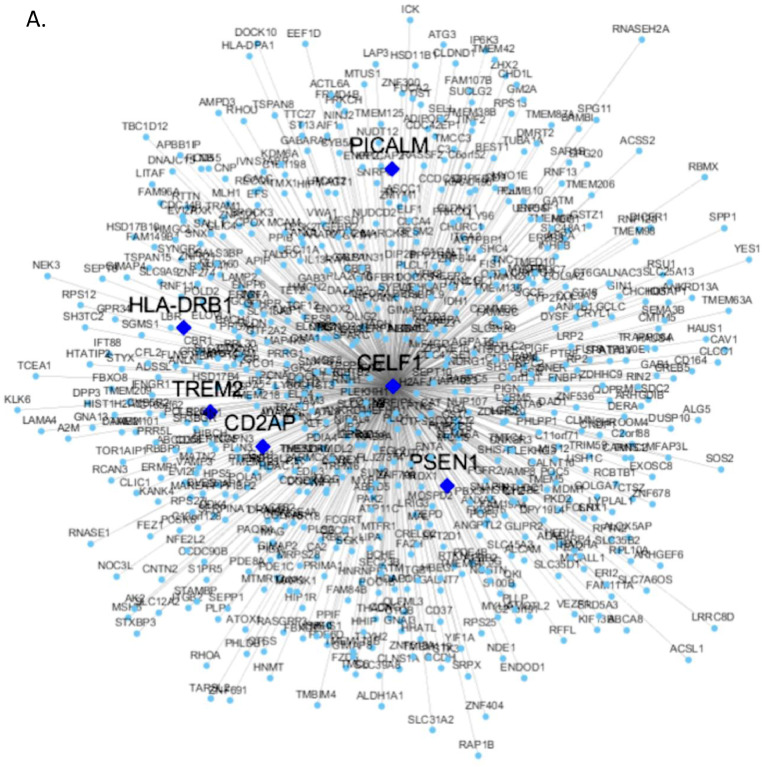
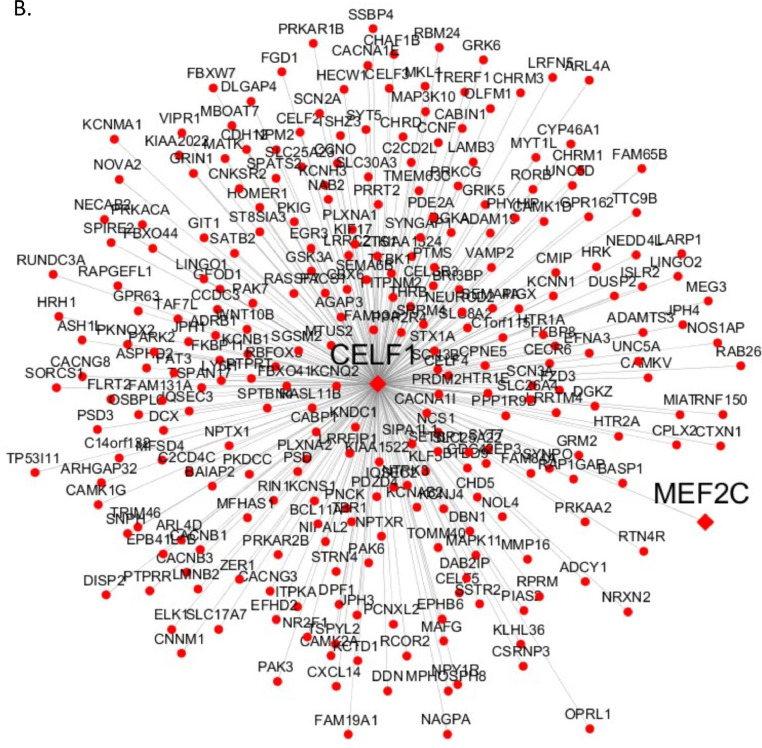
Fig. 5.
CELF1 centered consensus gene network in AD. (A) Genes negatively correlated with CELF1 represented by blue circle nodes and (B) genes positively correlated with CELF1 represented by red circle nodes. In both network plots, the diamond nodes are AD risk genes. (For interpretation of the references to color in this figure legend, the reader is referred to the web version of this article.)


