
Figure 3.
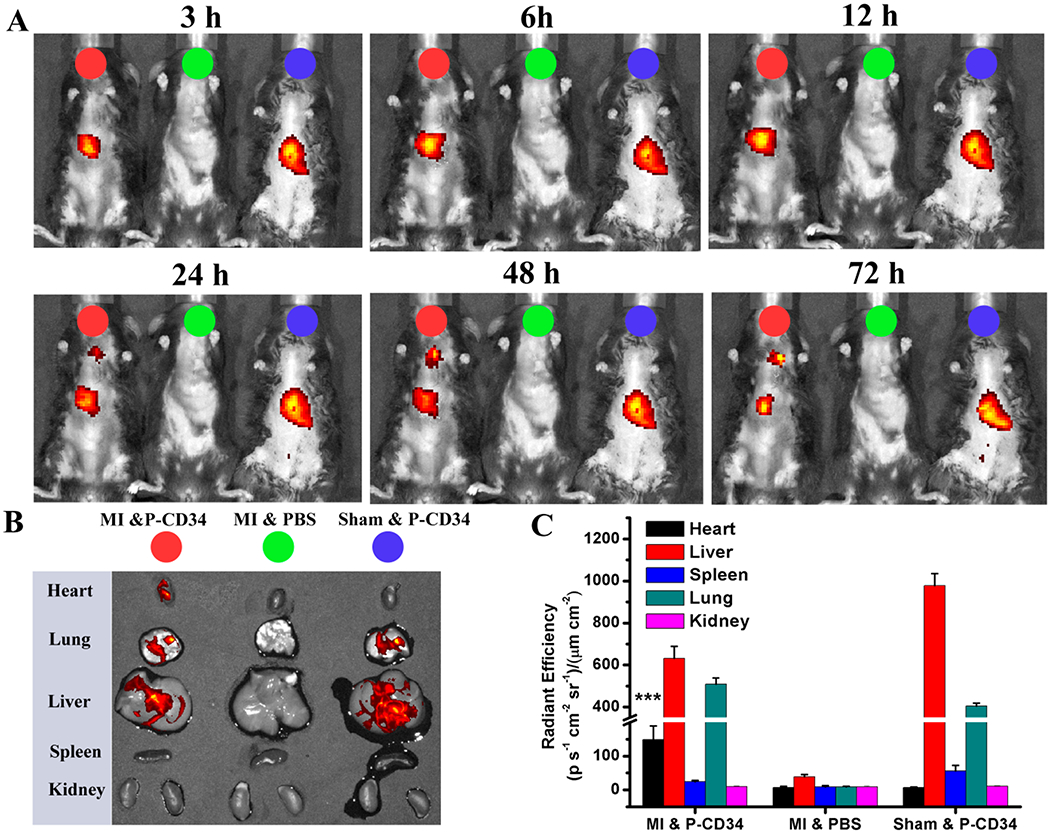
Biodistribution of P-CD34 in mice with acute MI. (A) In vivo fluorescent imaging of MI mice or sham mouse at various time interval after intravenous injection of DiR-labeled P-CD34 or PBS. (B) Ex vivo fluorescent imaging of the major organs from the treated animals. (C) Quantitative analysis of fluorescent intensity in the organs. P-CD34 treated groups vs other groups. Triple asterisks indicate P < 0.005.