
Figure 6.
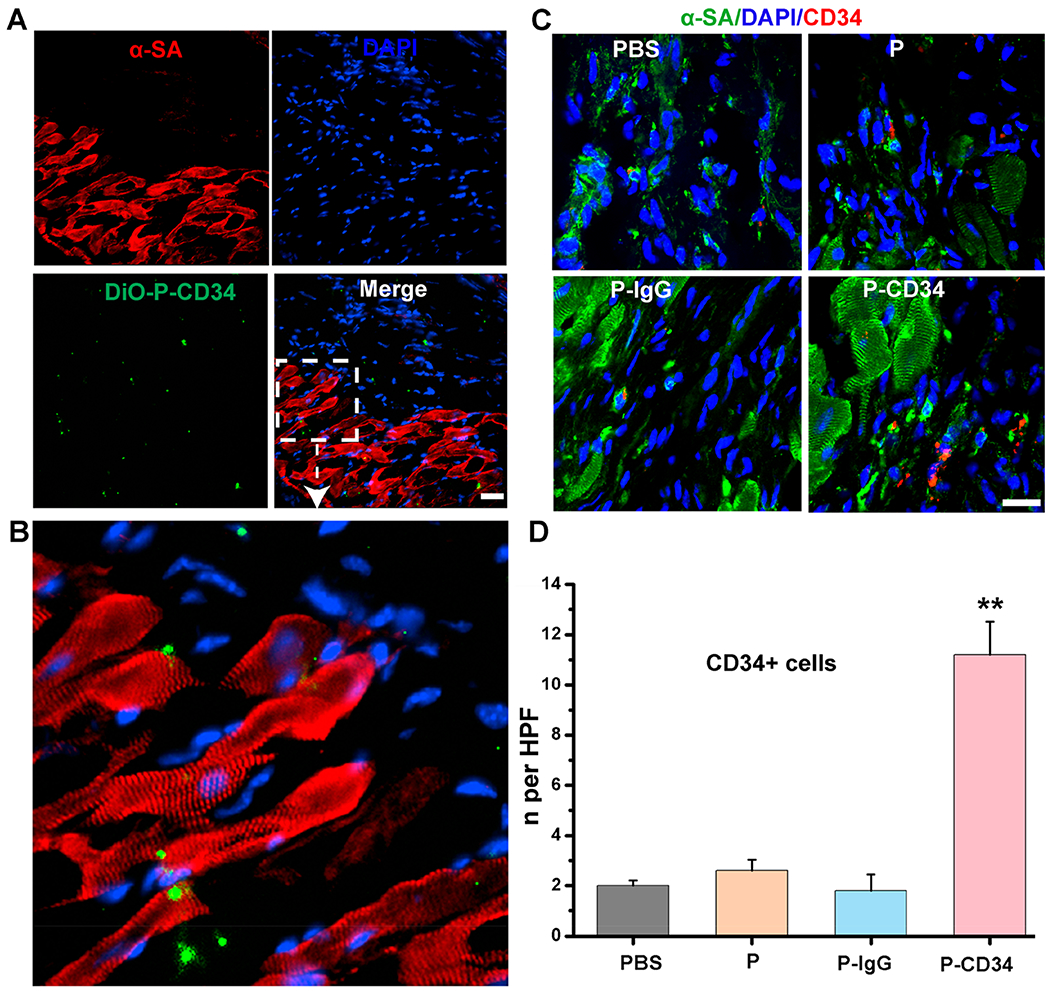
Evaluation of the mechanism for improved treatment effects. (A) Fluorescent micrographs confirming the ability of P-CD34 to target the MI area. (B) The enlarged image of panel A. (C) Representative images showing CD34-positive cells in hearts treated with control PBS, platelets, IgG-modified-platelets, or CD34-attached-platelets at 4 weeks. (D) Quantitative analysis of the number of CD34-positive cells. Scale bar: 20 μm; P-CD34 groups vs other groups; double asterisks indicate p < 0.01.