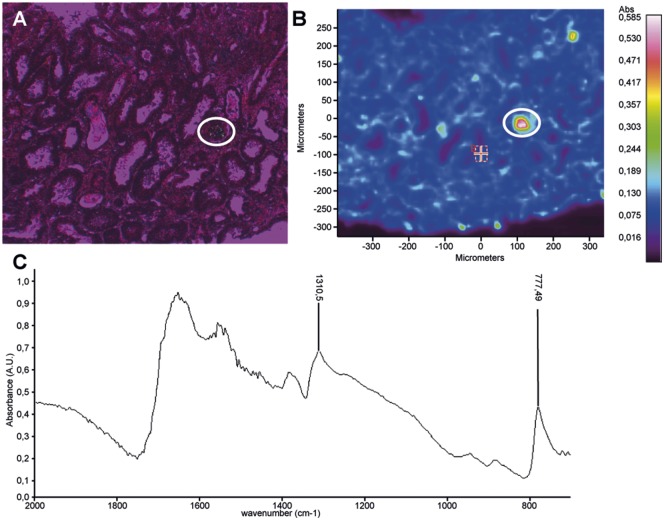
FIGURE 3.
Spectrophotometry analysis. Calcium oxalate monohydrate infrared (IR) spectrum displays typical absorption bands at 1310 and 777 cm−1. (A) Optical image (circle: polarized crystals). (B) Absorption image. (C) Typical IR spectrum of calcium oxalate monohydrate in a protein tissue (renal biopsy).

