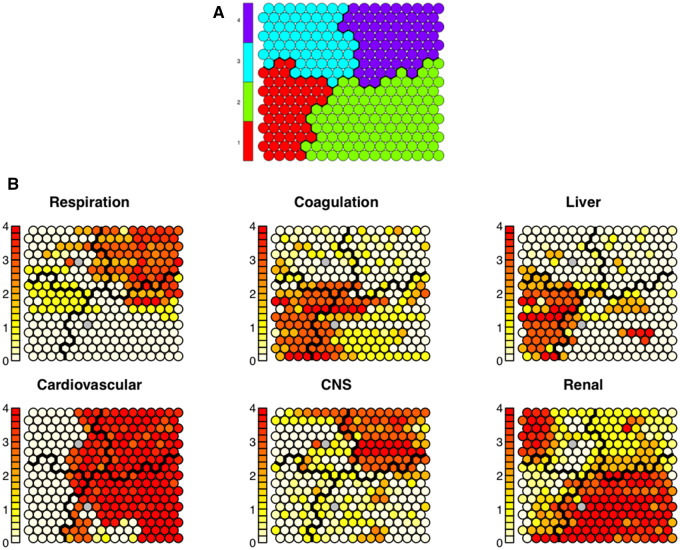
Figure 2.
(A) The resulting Kohonen Self-Organizing Map (SOM) depicting overall clusters—color-coded and separated by black lines. Each SOM node contains 5–35 intensive care unit (ICU) stays extremely similar to each other. (D) Shows those same clusters but with depictions of individual sequential organ failure (SOFA) subscores of the nodes within each cluster. Within each node, the given value is represented by the darkness of the color in the node. Each node is shaded from white to red, where darker colors represent higher average values (ie, higher SOFA subscores) among the ICU stays in the given node. The distribution of the SOFA subcomponents shows clear distinctions among the 4 clusters. The patterns visible in (B) suggest that the 4 clusters represent: 1) liver disease, 2) cardiogenic dysfunction with elevated creatinine, 3) minimal organ dysfunction, and 4) cardiogenic dysfunction with hypoxemia and altered mental status.

