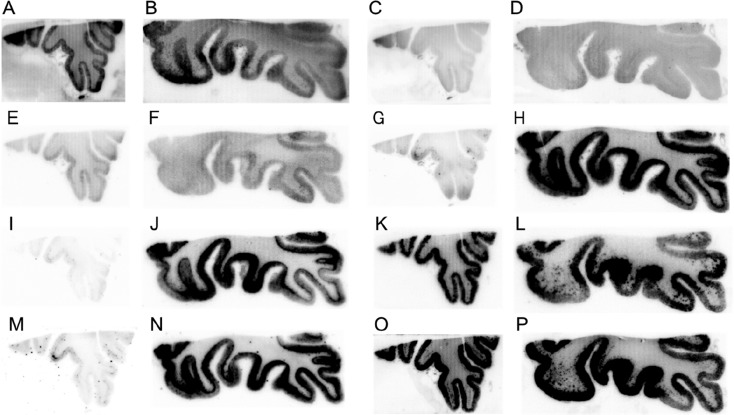
Figure 4.
Comparison of in vitro autoradiography of [125I]10 (A and B), [125I]11 (C and D), [125I]12 (E and F), [125I]21 (G and H), [125I]22 (I and J), [125I]23 (K and L), [125I]BIP-NMe2 (M and N), and [125I]IMPY (O and P) in brain sections from an AD patient. A, C, E, G, I, K, M, and O show results in Aβ(+)/tau(−) brain sections. B, D, F, H, J, L, N, and P show results in Aβ(+)/tau(+) brain sections.

