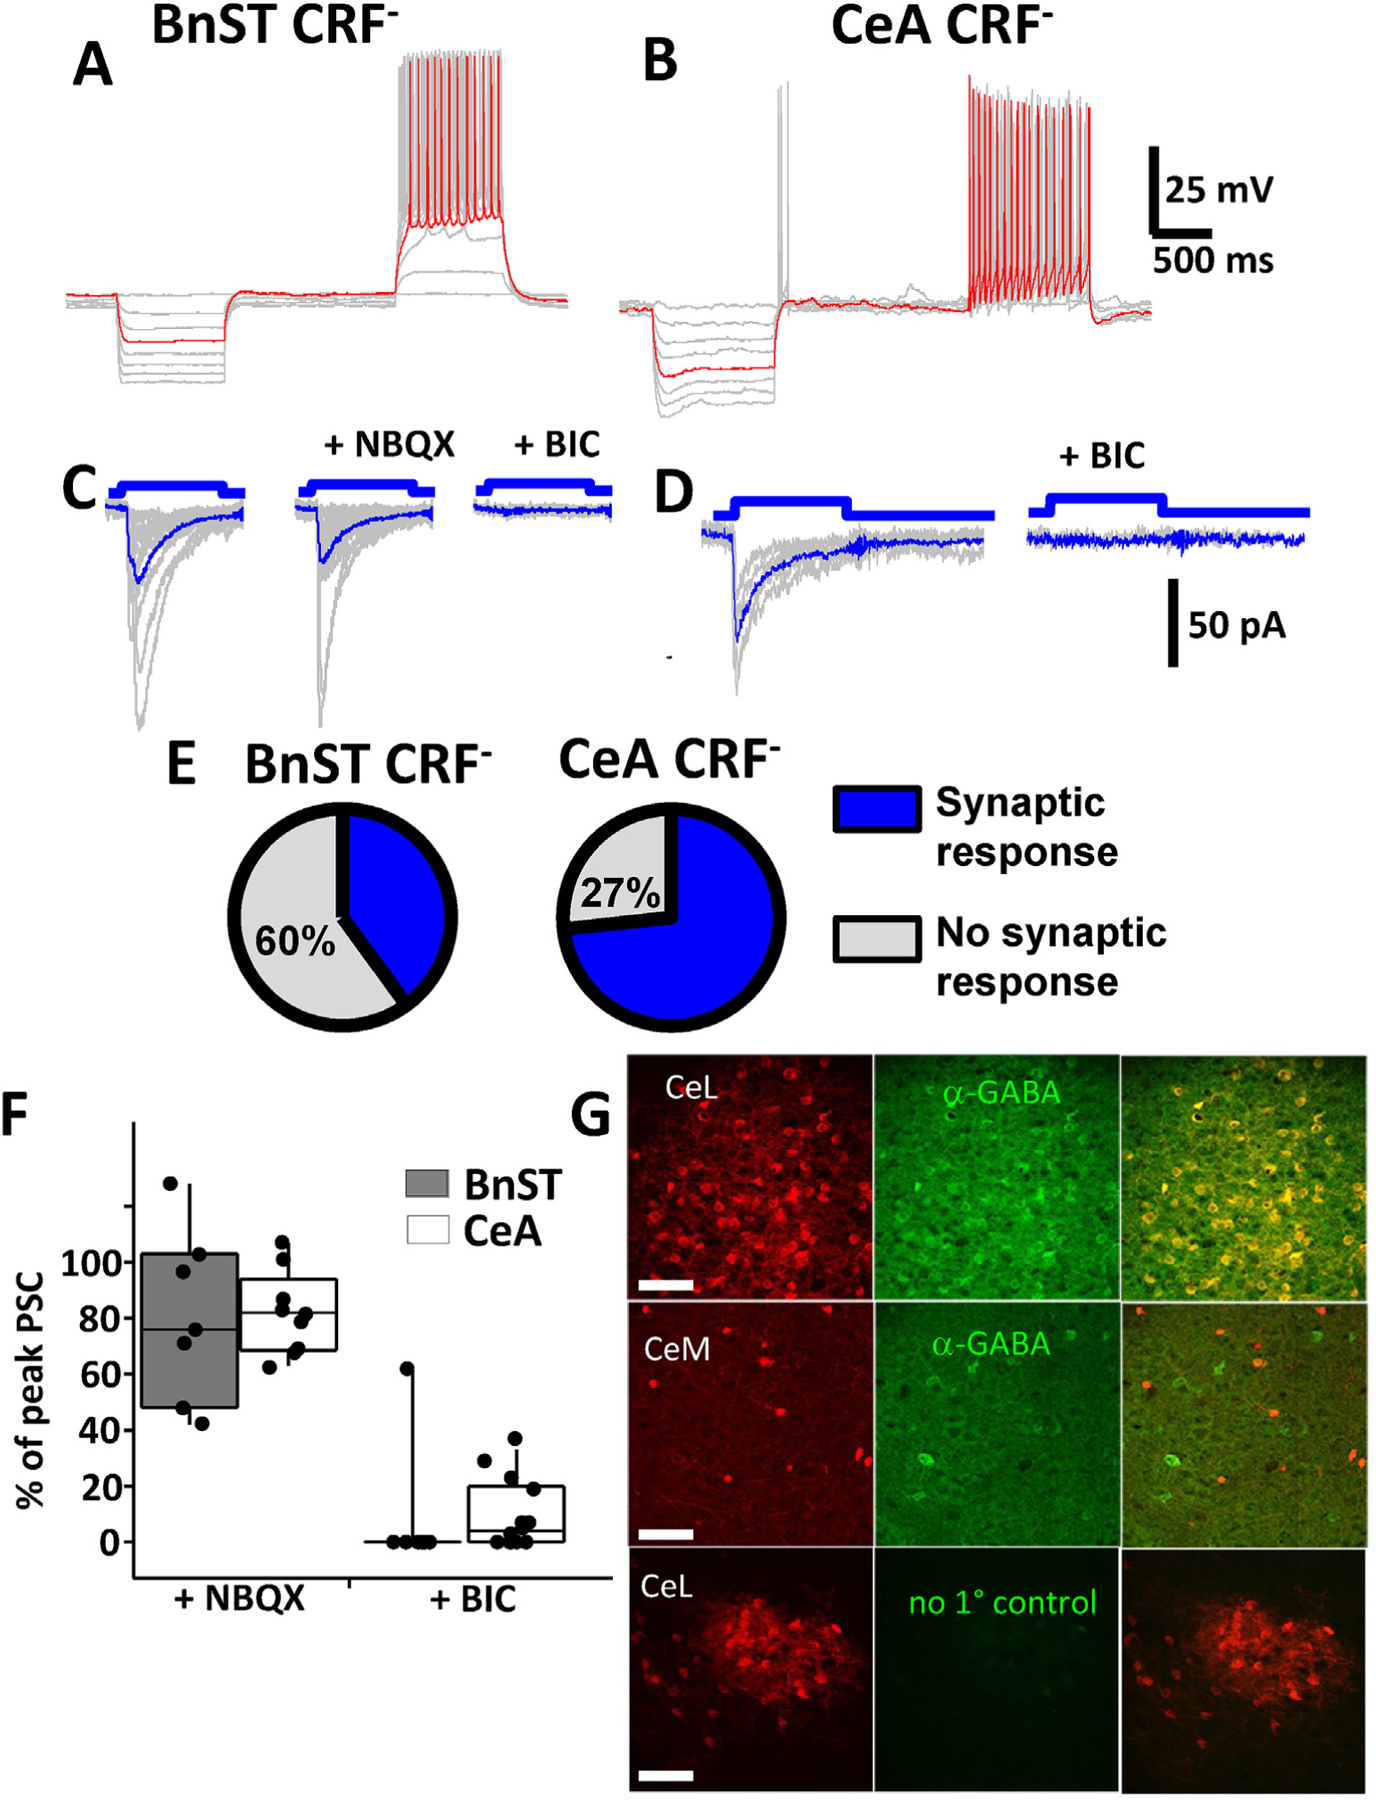
Fig. 3.

Optogenetic activation of GABAergic currents in unidentified CRF− lacking neurons. Current clamp recordings from an unlabeled neuron in the BnST (A) or CeA (B) from a crf;ChR2-YFP mouse. Shown are voltage responses to 10 pA hyperpolarizing and depolarizing current injection steps highlighting the differences in firing patterns of these neurons (superimposed gray traces, example trace in red). Voltage clamp recordings (superimposed gray traces, average blue trace) of light evoked (100 ms pulse) postsynaptic currents in the absence and presence of 5 μM NBQX or 25 μM BIC in a CRF− neuron in BnST (C) or 25 μM BIC in CeA (D). (E) Pie chart depicting the percentage of synaptically responsive CRF− neurons (blue wedge) in BnST (left) and CeA (right). Unresponsive CRF− neurons are depicted in gray. Summary box and whisker plots comparing the pharmacological effects on the % inhibitory effect of NBQX (left) or BIC (right) on light evoked postsynaptic currents (PSC) from BnST (gray bars) or CeA (white bars) (F). Immuno-detection of GABA in CRF+ neurons expressing td-Tomato (G). Anatomical distribution is compared between crf-mediated tdTomato expression (red, left), anti-GABA antibody staining (green, middle) and merged images (yellow, right). The top panels are from CeL while the middle panels are from nearby CeM. The bottom panels are control immunostaining lacking primary antibodies from CeL. Scale bars 100 μm.
