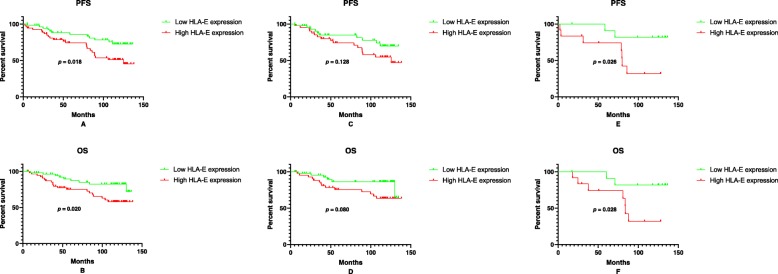
Fig. 3.
Kaplan-Meier survival analysis for patients with low-grade gliomasa. The figure shows comparisons of (a) PFS between high and low HLA-E expression group in LGG patients (p = 0.018); (b) OS between the two subgroups in LGG patients (p = 0.020); (c) PFS between the two subgroups in patients with diffuse astrocytomas (p = 0.128); (d) OS between the two subgroups patients with diffuse astrocytomas (p = 0.080); (e) PFS between the two subgroups in patients with oligodendrogliomas (p = 0.026); (f) OS between the two subgroups patients with oligodendrogliomas (p = 0.028). PFS, progression-free survival; OS, overall survival. aResults of Log-rank test.

