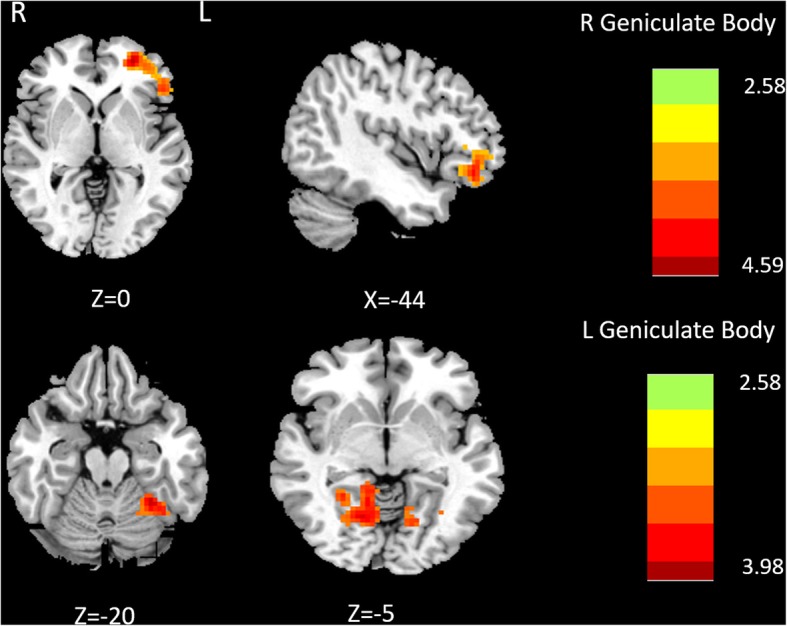
Fig. 2.

Comparison of FC of lateral geniculate nucleus between MwoA and HC. Warm color represents altered functional connectivity. MwoA patients showed increased functional connectivity compared with HC (red areas), full list of structures in Table 2. The right side of the brain refers to the left hemisphere and vice versa. The axial image was overlaid on the transverse section of the MNI-152 standard anatomical image. The z coordinate of each slice in the MNI-152 standard space is given
