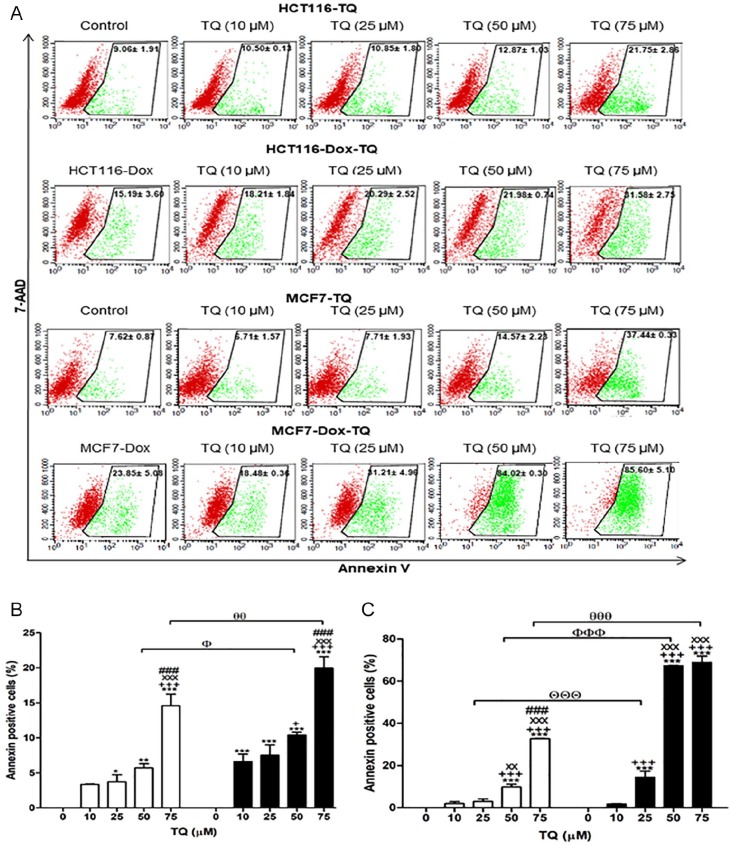
Figure 6.
Apoptotic potential of thymoquinone (TQ) using the annexin-V assay. (A) Flow cytometric analysis of both proliferative and Dox-treated HCT116 and MCF7 cells. Red color represents the live cells, and green color represents the annexin-V–positive cells. (B) The percentages of annexin-V–positive cells of proliferative HCT116 and Dox-treated HCT116. (C) The percentages of annexin-V–positive cells of proliferative MCF7 and Dox-treated MCF7. Cells were exposed to TQ (0, 10, 25, 50, and 75 µM) for 24 hours. TQ (0 µM) is a control for the corresponding proliferative or senescent of either HCT116 or MCF7. Data of all concentrations were subtracted by the data of 0 µM. Data were analyzed with 2-way ANOVA followed by Bonferroni posttest. *P < .05, **P < .01, and ***P < .001 versus TQ 0 µM. +P < .05 and +++P < .001 versus TQ 10 µM. xxP < .01 and xxxP < 0.001 versus TQ 25 µM. ###P < .001 versus TQ 50 µM for HCT116, HCT116-Dox, MCF7, and MCF7-Dox, separately. ΘΘΘP < .001 versus TQ 25 µM in proliferative and Dox-treated cells. ФP < .05 and ФФФP < .001 versus TQ 50 µM in proliferative and Dox-treated cells. θθP < .01 and θθθP < .001 versus TQ 75 µM in proliferative and Dox-treated cells. Error bars represent mean ± SD. PE-annexin-V signals were observed at excitation/emission 496, 546, and 565⁄578 nm. Control refers to proliferative cancer cells. HCT116-Dox refers to control senescent HCT116 cells. MCF7-Dox refers to control senescent MCF7 cells. White bars refer to proliferative cancer cells. Black bars refer to senescent cancer cells.

