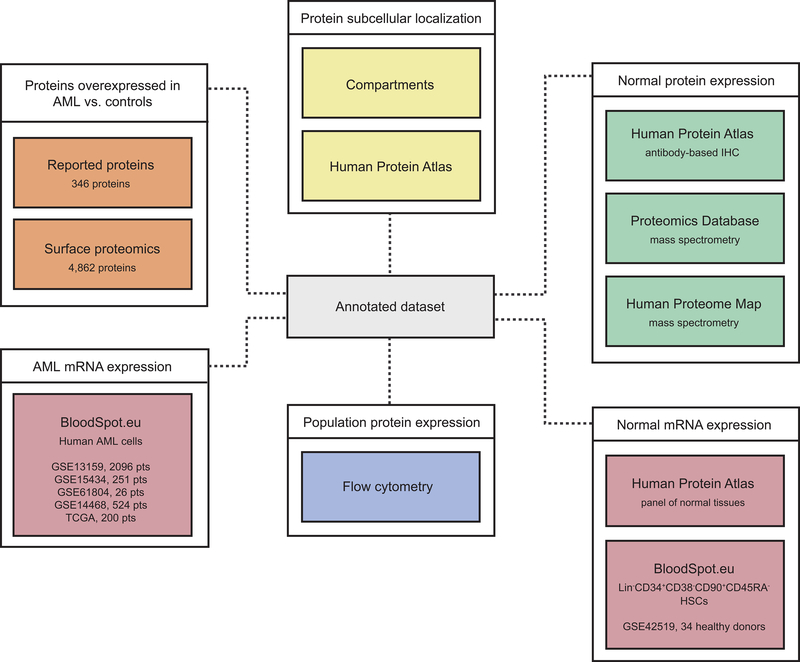
Figure 1. Generation of a comprehensive dataset of AML surface molecule annotations.
Orange boxes represent the information derived from proteomics studies in AML. Yellow boxes represent data sources providing information on subcellular localization. Green boxes represent three distinct published repositories of protein expression in several normal tissues and the platforms in which those data was generated. Pink boxes represent RNA data from AML (left) or normal cells (right). The blue box represents expression data obtained by flow cytometry in multiple distinct subsets of hematopoietic cells. The grey box at the center represents the combined annotation repository. See also Figure S1 and Table S1.

