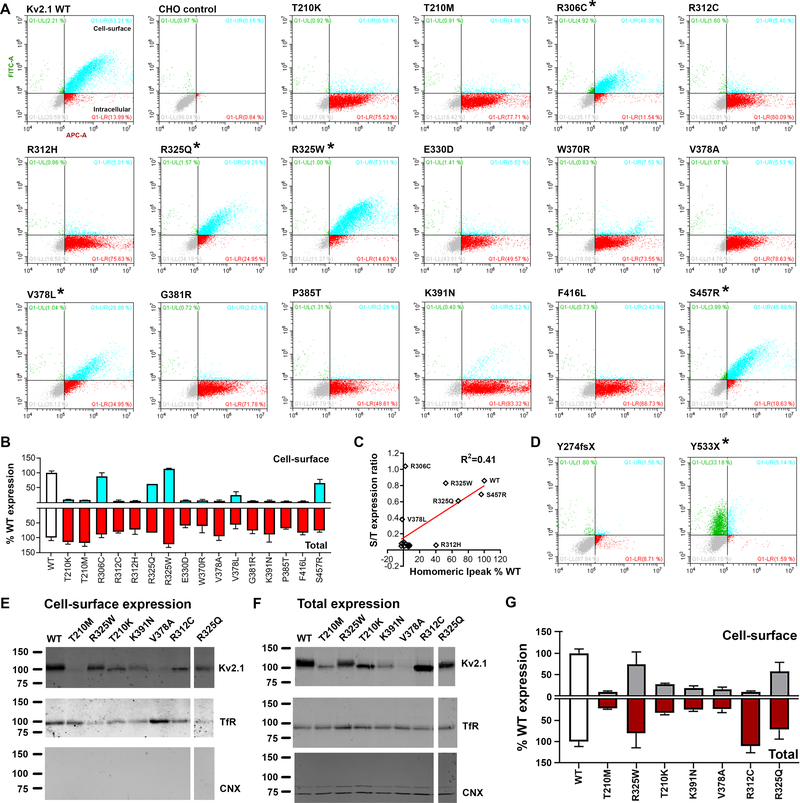
Figure 3. Total and cell-surface protein expression levels of KV2.1 variants.
A. Representative dot-plots of flow cytometry analyses of CHO cells expressing KV2.1 tagged with HA-epitope at the extracellular site between S1-S2 linker regions; anti-HA-Alexa488 and anti-KV2.1-Alexa647 antibodies were used to probe the cell-surface and intracellular KV2.1 respectively. Population in turquoise (HA+/KV2.1+) denote KV2.1 located at the cell-surface, while the dots in red (HA+/KV2.1-) indicate expressed KV2.1 protein located intracellular. WT and non-transfected CHO cells (negative control) are shown at the top left for comparison. Non-transfected CHO cells underwent the entire immunocytochemistry labeling protocol. B. Expression level comparisons of KV2.1 variants to that of WT (white bars) revealed reduced cell-surface trafficking of variants (* denote variants with intact cell-surface trafficking, i.e. S/T ratio > 0.3): cell-surface expression in turquoise and the total expression in red. C. Correlational analyses of surface-to-total expression level ratio and homomeric Ipeak density (values in % WT) result in R2=0.41 and p=0.006: Pearson’s. D. Analyses of two truncation variants, devoid of the epitope site for anti-KV2.1-Alexa647, further validate the assay. The Y274fsX36 variant fails to reach the cell-surface. In contrast, for the Y533X, the population in green (HA+/KV2.1-) denote KV2.1 expressed and reaching the cell-surface, yet unable to be detected by the anti-KV2.1-Alexa647 antibody due to the absent epitope. E-F. Cross-validation analyses of select KV2.1variants for cell-surface and total protein expression; Transferrin receptor (TfR), calnexin (CNX). G. Quantification of western blot analyses confirms similar expression pattern as ICC-FC assay.

