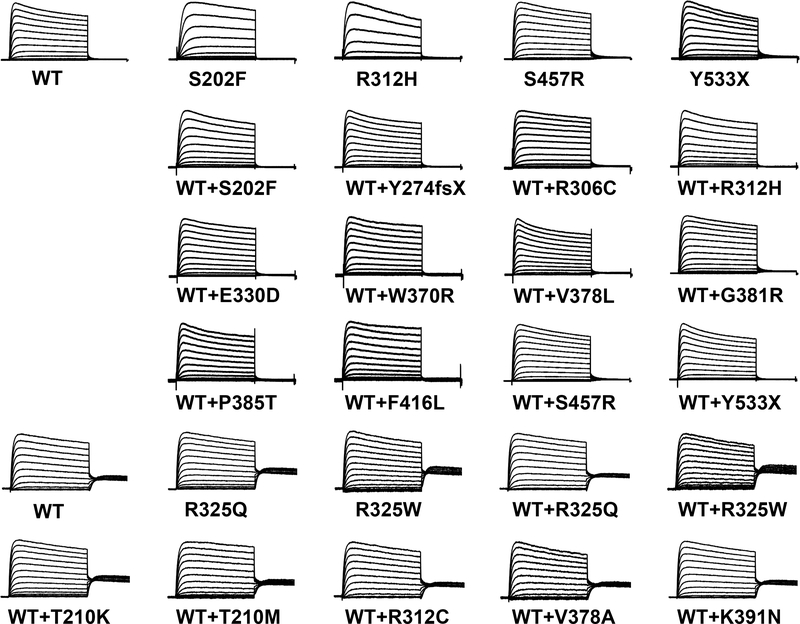
Figure 4. Averaged current density traces normalized to the maximal peak.
Averaged whole-cell currents recorded from CHO-K1 cells transiently expressing homomeric WT or variant KV2.1, or co-expressing WT+variant KV2.1 and normalized to the maximum peak current at +60 mV. Traces were normalized to peak current to enable comparison of gating behaviors among variants with divergent current density. Horizontal scale bar represents 200 ms.

