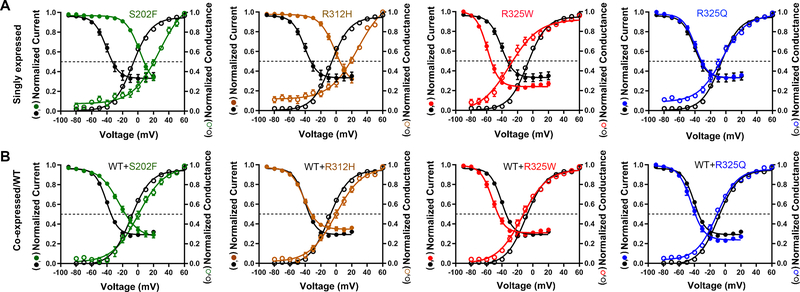
Figure 5. Voltage-dependence of activation/inactivation of KV2.1 variants.
A-B. Voltage-dependent channel activation (open circles) and inactivation (solid circles) curves obtained from selected homomeric and co-expression KV2.1 variants, compared to WT (circles in black). Solid lines represent averaged data fits with the Boltzmann equation. Numerical values of V1/2 and slope factor (k) for the other variants are listed in Table 1.

