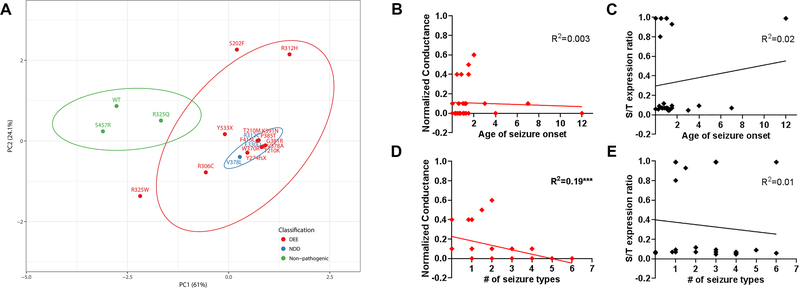
Figure 6. Principal component analyses of KV2.1 variants.
A. Experimental data for biophysical and protein expression analyses were transformed with respect to WT, to generate eigenvector-based multivariate analyses, and plotted using ClustVis 20. Nipals PCA is used to calculate principal components, with ellipses depicting 95% confidence interval. Each axes explains 61% and 24.1% of the total variance (X and Y, in order): N = 20 data points. Total of 6 variables measured in the homomeric condition were used: Ipeak density, V1/2 and k for activation and inactivation, protein expression cell-surface/total ratio. The top 3 leading dimensions (variable) for PC1 were Ipeak density (0.61), cell-surface/total expression ratio (0.62), V1/2 for activation (−0.28); and for PC2 were Ipeak density (0.62), and inactivation V1/2 (0.47) and k (0.49). Nonpathogenic variants and WT (in green) are separable from the pathogenic variants (red, blue). DEE, developmental epileptic encephalopathy; NDD, neurodevelopmental disorder. B-E. Correlational analysis of quantifiable clinical parameters and the leading functional parameters identified in this study. Conductance values normalized to that of WT and surface-to-total protein expression ratio were used for analyses. R2 values are noted for each plot (***p<0.02, Spearman’s).

