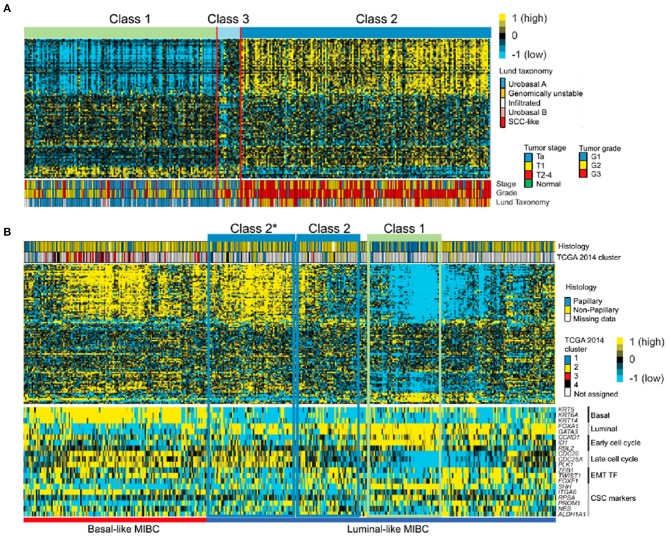
Figure 3.
The correlation among UROMOL 2016 and other molecular subtyping systems (33). (A) The UROMOL 2016 subytping system analyzed the microarray data from 306 tumors from the Lund group based on 95 of 117 classifier genes (33). The Class 1 subtype is highly similar to the urobasal A subtype, and Class 1 subtypes mainly consist of low-risk NMIBC, while high-risk NMIBC tends to be concentrated in the Class 3 and Class 2 subtypes. (B) UROMOL 2016 was used to subtype the TCGA database (33). Heatmap of mRNA-seq data from 408 MIBC samples from TCGA based on 107 of the 117 classifier genes. Class 1 and Class 2 tumors are highlighted based on expression profile similarities to original classes. Class 2*: tumors with high similarity to Class 2 but with differences in EMT and CSC marker expression (33). Yellow, high expression; blue, low expression. SSC, squamous cell carcinoma; EMT, endothelial-mesenchymal transformation; CSC: cancer stem cell.

