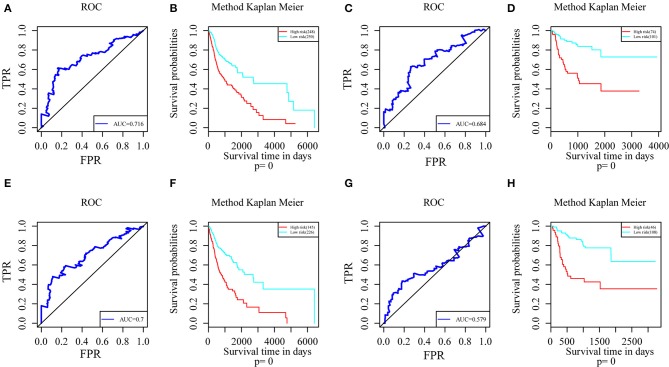
Figure 6.
ROC curves and Kaplan-Meier plots of prognostic predictors for seven potential feature genes in HNSCC patients. (A) ROC curves with overall survival AUCs of prognostic predictors plotted for transcriptional events in HNSCC. (B) Kaplan-Meier curves with overall survival of prognostic predictor plotted for transcriptional events in HNSCC. (C) ROC curves with overall survival AUCs of prognostic predictors plotted for AS events in HNSCC. (D) Kaplan-Meier curves with overall survival of prognostic predictor plotted for AS events in HNSCC. (E) ROC curves with recurrence AUCs of prognostic predictors plotted for AS events in HNSCC. (F) Kaplan-Meier curves with recurrence of prognostic predictor plotted for AS events in HNSCC. (G) ROC curves with recurrence AUCs of prognostic predictors plotted for AS events in HNSCC. (H) Kaplan-Meier curves with recurrence of prognostic predictor plotted for AS events in HNSCC.

