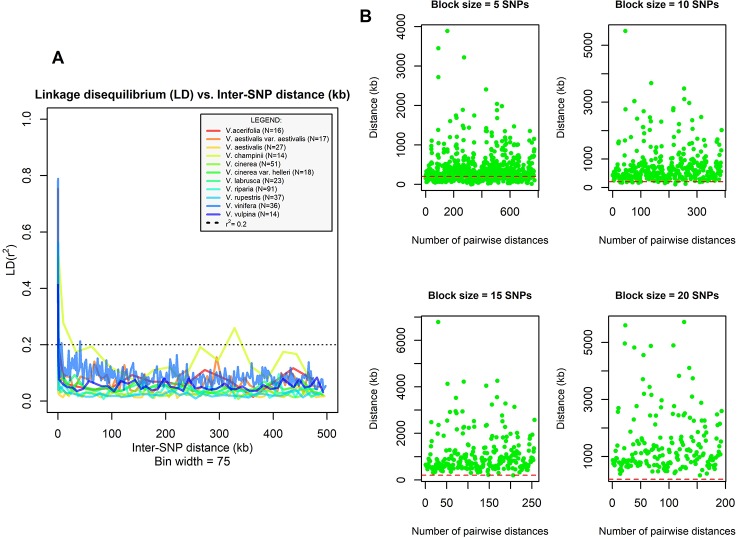
Figure 1.
(A) Linkage disequilibrium (LD) decay in ten grape species. The median r2 calculated in bins of 75 pairwise SNP comparisons was plotted against the mean physical distance of each bin (kb). Sample size for each species is shown in figure. Dotted line indicates r2 = 0.2. (B) Multistep procedure followed to identify the appropriate SNP block size used in TreeMix analysis. The SNP block size tested at each step is shown above plots. The physical distance (kb) between midpoints of consecutive blocks placed on the same chromosome is shown on y-axis while the x-axis shows the number of pairwise distances computed at each step. The dashed red line represents the assumed distance threshold (i.e., 200 kb).

