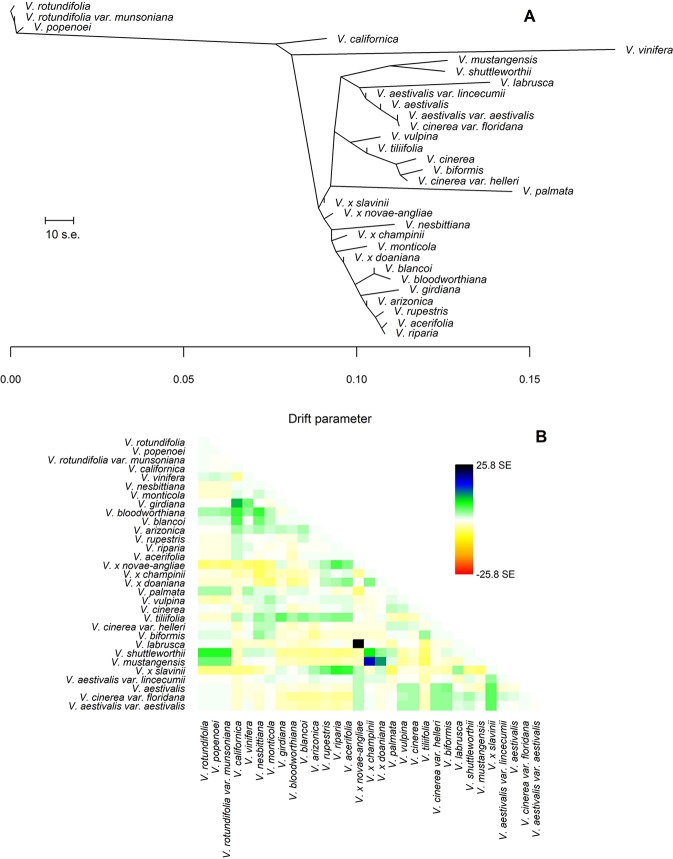
Figure 2.
(A) The Maximum Likelihood (ML)-tree inferred by TreeMix under the strictly bifurcating model. The scale bar shows ten times the average standard error (s.e.) of the entries in the sample covariance matrix. Drift parameter is shown on the x-axis. (B) Scaled residuals from the fit of the model to the data. Without migration events 91.7% of the variance in relatedness between taxa was explained by the tree. Colors are described in the palette on the right.

