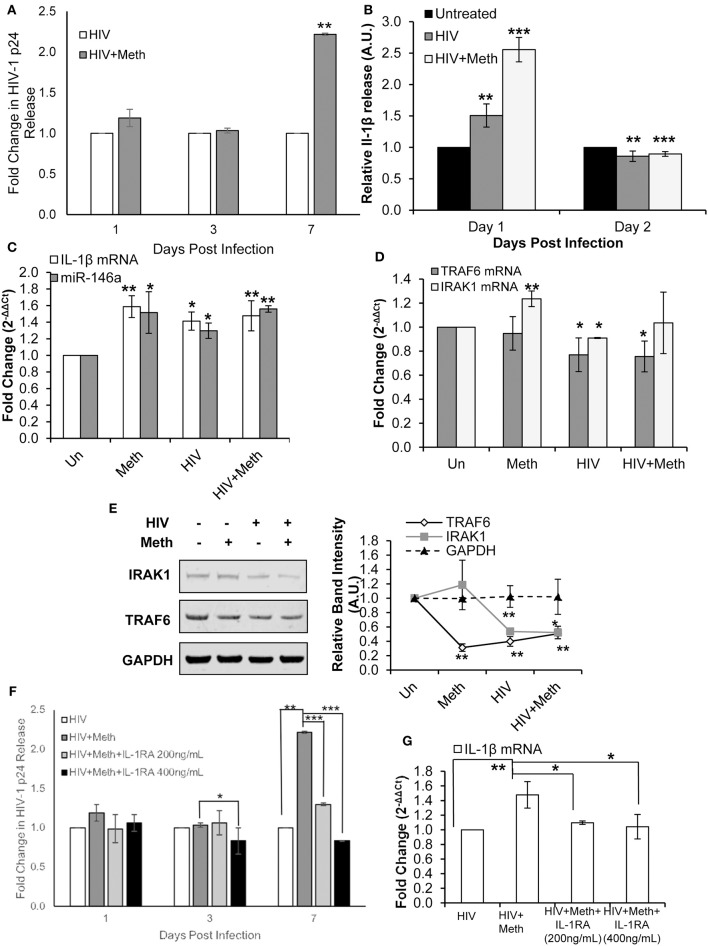
Figure 5.
Methamphetamine enhances HIV-1 replication via IL-1 signaling in CD4+ T-cells. CD4+ T-cells were uninfected, infected with HIV-1, treated with Meth alone, or treated with Meth and infected with HIV-1 concomitantly. Cells were harvested at 2 days post infection and supernatants were harvested at the time points indicated on graphs. (A) Culture supernatants were analyzed for HIV-1 replication by p24 ELISA, and p-values were calculated relative to untreated controls (**p < 0.01). (B) IL-1β ELISA was used to determine the concentration of IL-1β from culture supernatants harvested on days 1 and 2 P.I. Relative expression was calculated by normalizing HIV and HIV+Meth samples to untreated controls. Data represent the mean ± SD of 3 independent experiments, and p-values were calculated relative to untreated controls (**p < 0.01, ***p < 0.001). (C) miR-146a and IL-1β mRNA expression was determined by RT-qPCR. Fold change was calculated by normalizing Meth, HIV, or HIV+Meth samples to untreated controls. Data represent the mean ± SD of 3 independent experiments, and p-values were calculated relative to untreated controls (*p < 0.05, **p < 0.01). (D) RT-qPCR was performed to assess changes in TRAF6 and IRAK1 mRNA expression on day 2 P.I. Fold change was calculated by normalizing Meth, HIV or HIV+Meth samples to untreated control cells. Data represent the mean ± SD of 3 independent experiments, and p-values were calculated relative to untreated controls (*p < 0.05, **p < 0.01). (E) Cells were harvested and lysed on day 2 P.I. Protein extracts were analyzed for IRAK1 and TRAF6 by Western Blot. GAPDH was used as a loading control. Relative band intensity was calculated using ImageJ software, and p-values were calculated relative to untreated controls (*p < 0.05, **p < 0.01). (F) CD4+ T-cells were infected with HIV-1 alone, infected with HIV-1 and treated with Meth daily, or infected with HIV-1 and treated with Meth and IL-1RA (200 or 400 ng/mL) daily. Culture supernatants were analyzed for HIV-1 replication by p24 ELISA, and p-values were calculated relative to HIV+ for HIV+Meth samples, or relative to HIV+Meth for HIV+Meth+Il-1RA samples (*p < 0.05, **p < 0.01, ***p < 0.001). (G) Cells were harvested at 2 days P.I. IL-1β mRNA expression was analyzed by RT-qPCR. Fold change was calculated by normalizing HIV+Meth or HIV+IL-1RA to HIV+ samples. Data represent the mean ± SD of 3 independent experiments, and p values were calculated relative to HIV+ for HIV+Meth samples, and relative to HIV+Meth for HIV+Meth+IL-1RA samples (*p < 0.05, **p < 0.01).

