
Figure 5. DP-cKO Leads to Increased Inhibition in the SNR and Enhanced GPe Synapses.
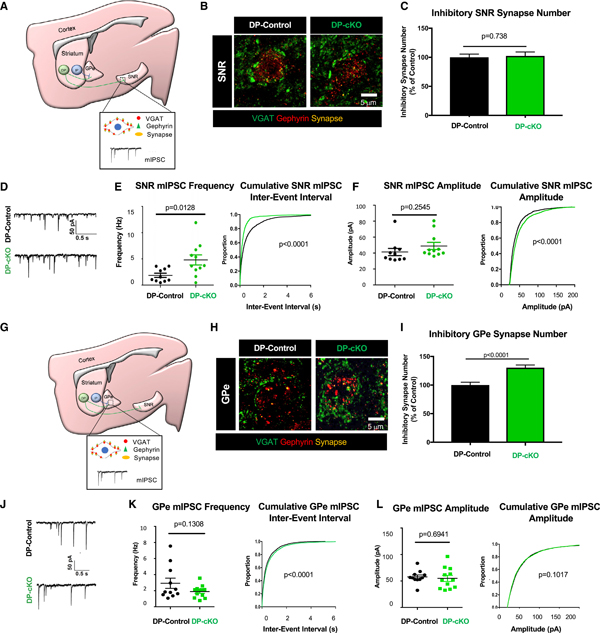
(A) Diagram of SNR synapse analyses of DP mice. GABAergic synapse staining with presynaptic VGAT (green) and postsynaptic gephyrin (red) in dorsal SNR neurons. Miniature inhibitory postsynaptic currents (mIPSCs) were recorded from dorsal SNR neurons.
(B) Representative images of inhibitory synapses in the SNR of 2-month-old DP-control and DP-cKO mice stained for VGAT (green) and gephyrin (red).
(C) Quantification of SNR inhibitory synapses of 2-month-old DP-controls and DP-cKOs (n = 3 replicates/animal, 3 animals/genotype, 90 images analyzed, nested ANOVA by genotype, F = 0.11292, df = 1, p = 0.73769; graph displays mean ± SEM).
(D) Sample traces of mIPSCs from 2-month-old DP-control and DP-cKO dorsal SNR neurons.
(E) Left: quantification of the mean frequency of mIPSCs (n = 10–11 cells per genotype, unpaired two-way t test, p = 0.0128, t = 2.749, df = 19, graph displays frequencies from individual neurons as well as mean ± SEM). Right: cumulative probability plots of inter-event interval (Kolmogorov-Smirnov test, p < 0.0001).
(F) Left: quantification of the mean amplitude of mIPSCs (n = 10–11 cells per genotype, unpaired two-way t test, p = 0.2545, t = 1.175, df = 19, graph displays frequencies from individual neurons as well as mean ± SEM). Right: cumulative probability plots of mIPSC amplitude (Kolmogorov-Smirnov test, p < 0.0001).
(G) Diagram of GPe synapse analysis approach. GABAergic synapse staining with presynaptic VGAT (green) and postsynaptic gephyrin (red) in the GPe. mIPSCs were recorded from neurons in the medial GPe.
(H) Representative images of inhibitory synapses in the GPe of 2-month-old DP-control and DP-cKO mice stained for VGAT (green) and gephyrin (red).
(I) Quantification of inhibitory synapses in the GPe of 2-month-old DP-controls and DP-cKOs (n = 3 replicates/animal, 3 animals/genotype, 90 images analyzed, nested ANOVA by genotype, F = 20.462, df = 1, p < 0.0001; graph displays mean ± SEM).
(J) Sample traces of mIPSCs from 2-month-old DP-control and DP-cKO GPe neurons.
(K) Left: quantification of the mean frequency of GPe mIPSCs (n = 11–12 cells per genotype, unpaired two-way t test, p = 0.1308, t = 1.572, df = 21, graph displays frequencies from individual neurons as well as mean ± SEM). Right: cumulative probability plots of inter-event interval (Kolmogorov-Smirnov test, p < 0.0001).
(L) Left: quantification of the mean amplitude of GPe mIPSCs (n = 11–12 cells per genotype, unpaired two-way t test, p = 0.6941, t = 0.3987, df = 21, graph displays frequencies from individual neurons as well as mean ± SEM). Right: cumulative probability plots of the mIPSC amplitude (Kolmogorov-Smirnov test, p = 0.1017).
See Figure S5.