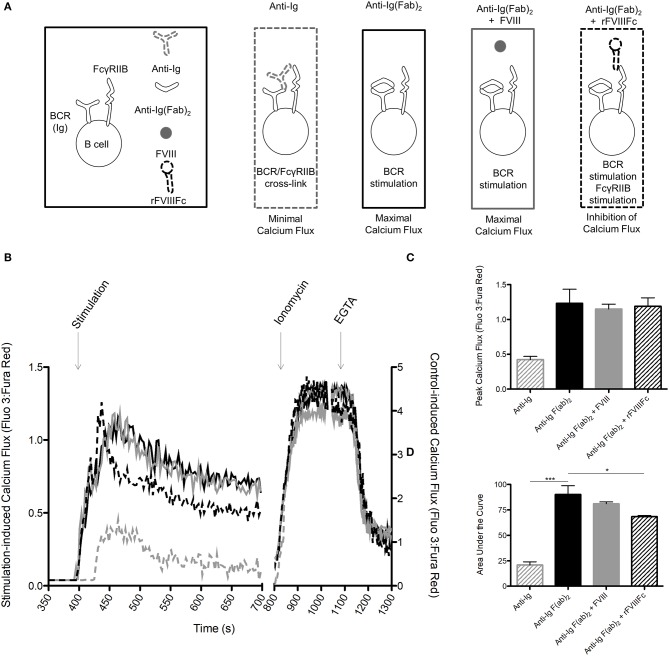
Figure 5.
rFVIIIFc inhibits anti-Ig F(ab)2 induced calcium flux in B cells. (A) Calcium flux assay stimulation conditions and their hypothesized outcomes. (B) Representative graph of calcium flux assay results. (C) Peak calcium flux and (D) area under the curve for B cells stimulated with anti-Ig (10 μg/ml), anti-Ig F(ab)2 (10 μg/ml), anti-Ig F(ab)2 + FVIII (10 + 11.4 μg/ml) and anti-Ig F(ab)2 + rFVIIIFc (10 + 14.7 μg/ml). n = 3/condition. Errors bars represent SD. *p < 0.05, ***p < 0.001.  , anti-Ig;
  , anti-Ig F(ab)2;
  , anti-Ig F(ab)2 + FVIII;
  , anti-Ig F(ab)2 + rFVIIIFc.

