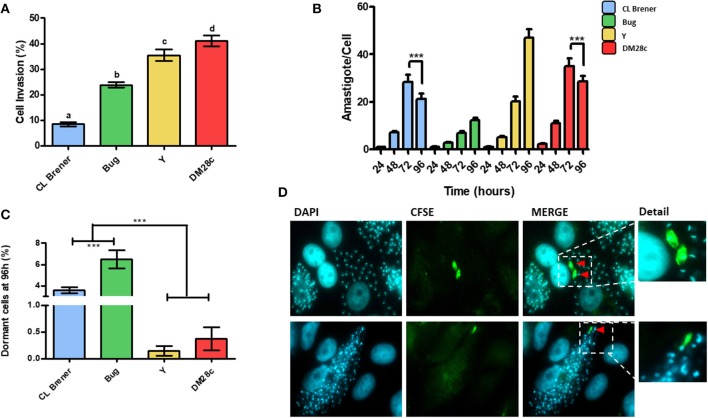
Figure 3.
Dormancy in amastigote forms of T. cruzi. (A) Invasion rate of CL Brener, Bug, Y, and Dm28c strains in LLC-MK2 cells. The graph shows the percentage of infected LLC-MK2 cells in a total of 250 cells were analyzed (parasites labeled with anti-T. cruzi antibody were disregarded). Letters indicate statistically significant differences among each strain (P-value <0.05). (B) T. cruzi infection progression. The graph shows the number of intracellular parasites per infected cells. A total of 100 infected LLC-MK2 cells were analyzed at each time point. Asterisks represent the statistically significant differences at 96 h post infection in CL Brener and Dm28c when compared to 72 h post infection (P-value <0.05). (C) The graph shows the percentage of intracellular amastigotes in a dormant state 96 h post-infection. A total of 100 LLC-MK2 infected cells were analyzed. Asterisks indicate statistically significant differences among groups (P-value <0.05). (D) Representative images of DM28c infected cultures, 96 h post-infection. Red arrows indicate dormant (CFSE+) amastigotes (upper panel) and CFSE positive trypomastigotes (lower panel) (100x). The CFSE+ amastigote and trypomastigote form were detailed. Representative results of two distinct experiments in three technical repetitions repeats.

