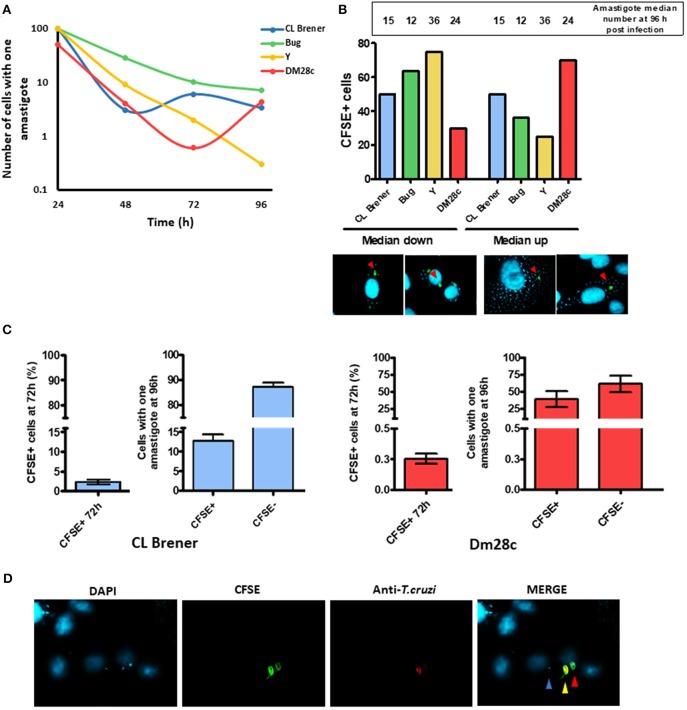
Figure 4.
Dormant reinfection characterization. (A) The graph shows the percentage of cells infected with a single amastigote along the infection. A total of 100 infected LLC-MK2 cells were analyzed at each time point and the infected cells with just one amastigote were counted. (B) The graph shows the percentage of cells containing CFSE-positive parasites according two groups of cells: one in which the number of intracellular parasites was higher than the median, and another one in which the number was lower than the median at 96 h post-infection. Values indicated in the bar are the median for each strain at 96 h post-infection. Below the graph, a representative figure depicting what was considered as cells with CFSE-positive parasites in a median down group or in median up group is shown. (C) The graph shows the percentage of cells infected with a single parasite from CL Brener or Dm28c strains at 96 h that is either CFSE-positive or -negative. A hundred single-infected cells were analyzed per assay. For the sake of comparison, besides each graphic the percentage of total CFSE positive CL Brener or Dm28c parasites at 72 h post-infection is shown. (D) Representative image of a cell infected with a single parasite (Dm28c strain), CFSE+ (red arrow) or CFSE- parasite (blue arrow) at 96 h post-infection. An external trypomastigote form is also shown (yellow arrow).

