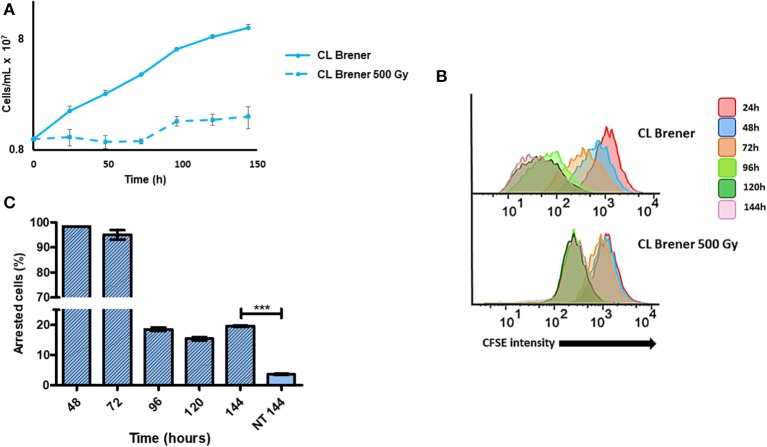
Figure 5.
Dormancy in epimastigotes from CL Brener strain after gamma radiation exposure. (A) A 144 h-growth curve of wild-type T. cruzi CL Brener strain exposed or not to 500 Gy of gamma irradiation. (B) Flow cytometry histograms of CFSE fluorescence intensity decay over time from epimastigotes exposed or not to 500 Gy. Cells that have similar CFSE fluorescence intensity compared to the level of half median of 24 h time point were considered as arrested. (C) The graph shows the percentage of arrested parasites determined by flow cytometry showing half of CFSE median intensity observed at 24 h of growth. The percentage of dormant parasites at 144 h- from a culture without exposure to gamma radiation (NT 144 h) is shown for the sake of comparison. Representative results of three distinct experiments are shown. Asterisks indicate statistically significant differences among groups (P-value <0.05).

