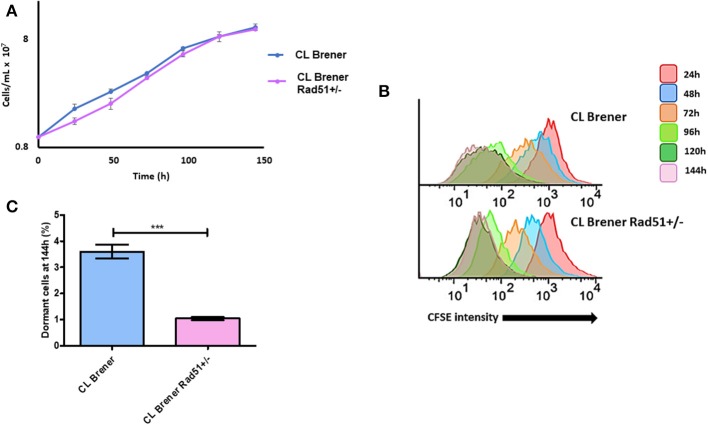
Figure 7.
Dormancy in epimastigote forms of T. cruzi CL Brener Rad51+/−. (A) Cellular growth curve of CL Brener wild-type strain and Rad51+/− mutant. At 0 h, 1 × 10⁷ cells were treated with CFSE, and samples were analyzed each 24 h for 144 h. (B) Flow cytometry histograms of epimastigote cultures from each strain. CFSE fluorescence intensity was followed every 24 h until 144 h. Cells that exhibited similar CFSE fluorescence intensity at 144 h when compared to the level of half median of 24 h were considered as dormants. (C) Average of dormant cells percentages in CL Brener and Rad51+/− mutants at 144 h was detected in flow cytometry histograms. Representative results of three experiments are shown. Asterisks indicate statistically significant differences among groups (P-value <0.05).

