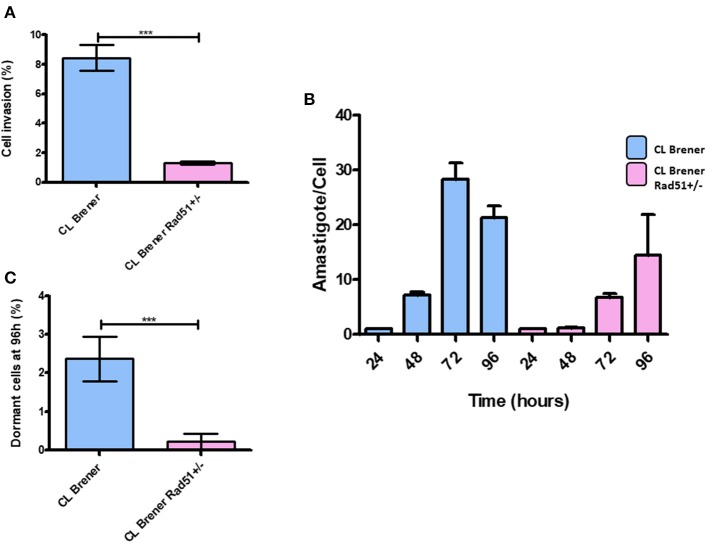
Figure 8.
Dormancy in amastigote forms of T. cruzi CL Brener Rad51+/−. (A) The graph shows the percentage of infected cells in LLC-MK2 cultures infected by T. cruzi CL Brener Rad51+/− mutants and WT cells. The number of 250 LLC-MK2 cells were analyzed (parasites labeled with anti-T. cruzi antibody were disregarded). Asterisk indicate statistically significant differences between strains (P-value <0.05). (B) The graph shows the rate of intracellular parasitic replication in LLC-MK2 cultures exposed to T. cruzi CL Brener Rad51+/− mutants and WT cells during 96 h of parasite exposure. A total of 100 infected LLC-MK2 cells were analyzed at each time point. (C) Percentage of intracellular parasites from T. cruzi CL Brener Rad51+/− mutants and WT cells showing high CFSE labeling 96 h post-infection. One hundred infected LLC-MK2 cells were analyzed, and the percentage of CFSE-positive ones in relation to the total number of intracellular parasites was determined.

