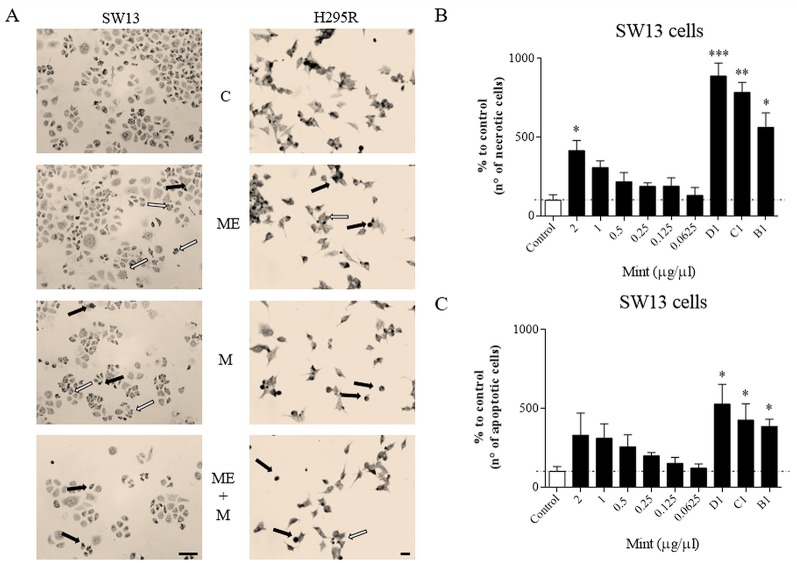
Figure 4.
Cells morphology evaluated by Wright's staining method in SW13 and H295R cells at 24 and 72 h, respectively. (A) representative pictures of SW13 and H295R cells. The arrows show apoptotic (white) or necrotic cells (black). (B, C) number of counted cells for SW13 cell line. B1: ME 0.25 μg/μl + mitotane 10μM. C1: ME 0.5 μg/μl + mitotane 10μM. D1: ME 1 μg/μl + mitotane 10μM. Treatment vs control: *p < 0.05; **p < 0.005; ***p < 0.001. At least 600 cells were counted for every experiment in 10 different fields and each experiment was repeated twice.

