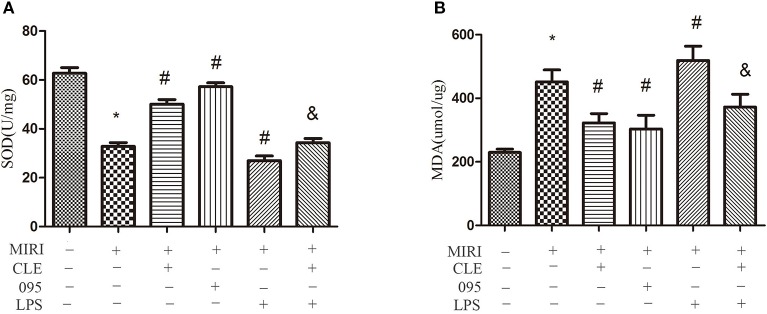
Figure 5.
Comparison of SOD vitality by Total Superoxide Dismutase Assay Kit with WST-8 and MDA content by Lipid Peroxidation MDA Assay Kit in MIRI H9C2 cardiomyocyte. (A) Statistical analysis graph of each group indicating SOD vitality. (B) Statistical analysis graph of each group indicating MDA content. Error bars represent SD (standard deviation), *indicates a significant difference compared with CON group, P < 0.05; #indicates a significant difference compared with myocardial ischemia-reperfusion injury (MIRI) group, P < 0.05; &indicates a significant difference compared with MIRI+lipopolysaccharide (LPS) group, P < 0.05.

