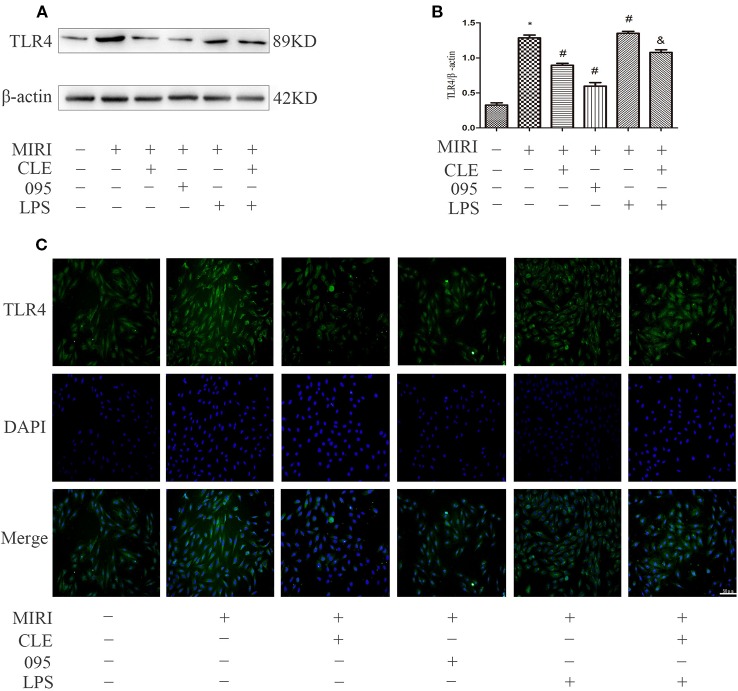
Figure 6.
Comparison of TLR4 expressions in H9C2 cardiomyocytes among groups using Western blotting and immunofluorescence. (A) Bar graphs showing TLR4 expressions in H9C2 cardiomyocytes of each group. (B) Statistical analysis graph of each group indicating TLR4 levels in H9C2 cardiomyocytes; error bars represent SD (standard deviation), *indicates a significant difference compared with CON group, P < 0.05; #indicates a significant difference compared with myocardial ischemia-reperfusion injury (MIRI) group, P < 0.05; &indicates a significant difference compared with MIRI+LPS group, P < 0.05. (C) Immunofluorescence staining showing TLR4 expressions in H9C2 cardiomyocytes of each group. Green represents TLR4 and blue represents the nuclei. Scale bar: 50 μm.

